
Trains, Tracks and Tiles - Putting the Chicago L on a Peakboard Map
Most of what we put on a dashboard answers how much or how long. A map answers a different question,...
Read Article →Design readable, industrial dashboards that feel like a control panel—not a slideshow.
Most of what we put on a dashboard answers how much or how long. A map answers a different question,...
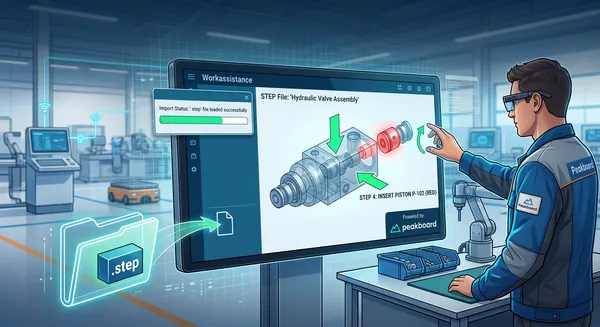
Read Article →Every manufacturing company has the same treasure lying around unused: a CAD system full of 3D models that describe every...
Read Article →Last week we pulled an Office 365 group calendar into Peakboard and watched its entries land in the Designer’s preview...
Read Article →Almost every Peakboard application that shows tabular data eventually needs a way to filter it. A shop floor terminal that...
Read Article →Every Peakboard developer has lived through this scene. We build a clean KPI tile, polish the typography, get the border...
Read Article →In this article, we will discuss two features introduced in early 2026 with Peakboard version 4.2: parameterized data flows and...
Read Article →Many Peakboard apps have text boxes that let the user submit some text. However, accepting text input isn’t as simple...
Read Article →Every Peakboard application is built around one or more screens. These screens are like the windows in a traditional desktop...
Read Article →