
In this article, we will discuss two features introduced in early 2026 with Peakboard version 4.2: parameterized data flows and nested styled lists. We are covering them in the same article because they are often used together, although it is not always necessary to do so.
For parameterized data flows, the main idea is simple: Give a data flow a parameter that can be set dynamically. This prevents the need to build multiple data flows that differ only in minor aspects. We can reuse the same data flow and make it dynamic by using a parameter.
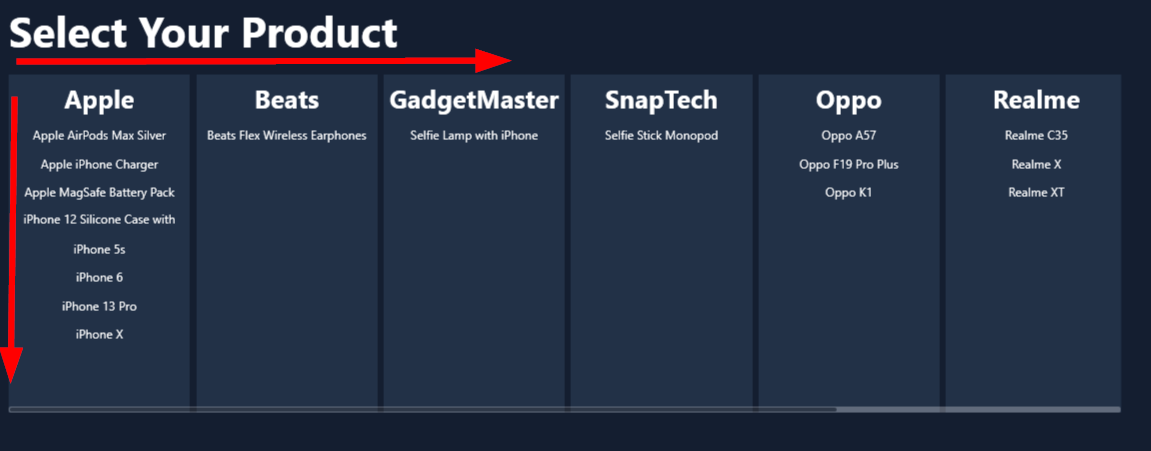
For nested styled lists, we refer to a traditional styled list where each list entry itself contains a styled list. This enables the creation of effective visualizations for two-dimensional data structures. If that sounds too abstract, here’s the sample we will build together: Let’s assume we have a simple list of products. Each product has a unique name and belongs to a certain brand. We want to create a visualization where all brands are displayed in a horizontal list, and all product names are listed in a vertical list for each brand. The first dimension is the brand, and the second dimension is the product, as shown in the screenshot.
Preparing the Data
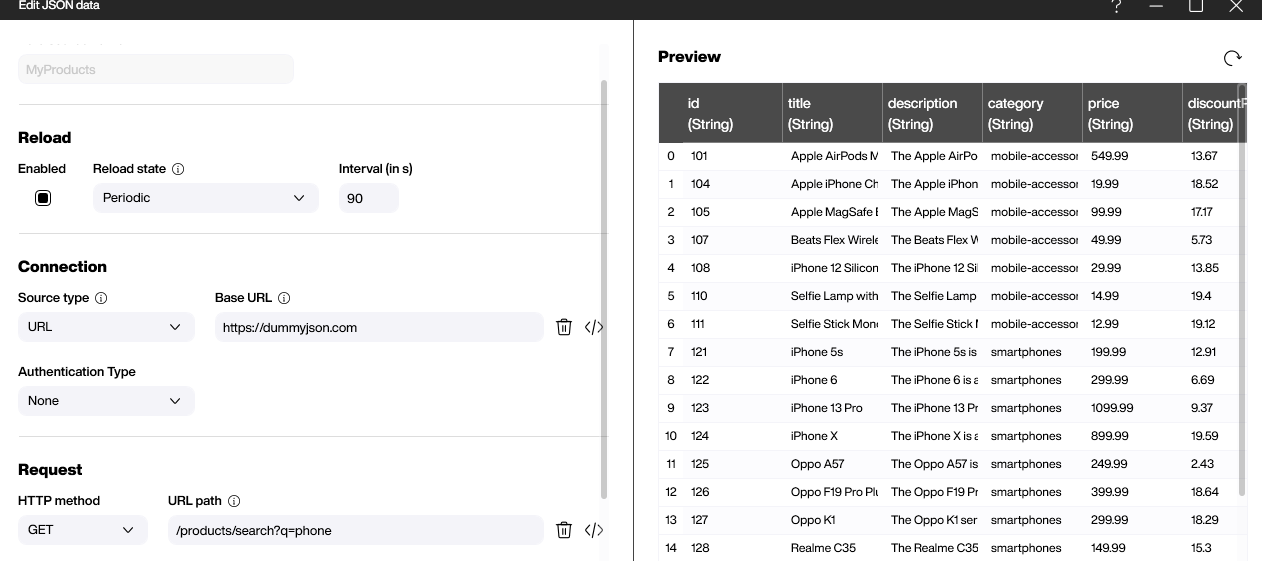
The foundation of our product list is a simple data source that is freely available here. For our purposes, there are two important columns: the title for the product name and the brand.
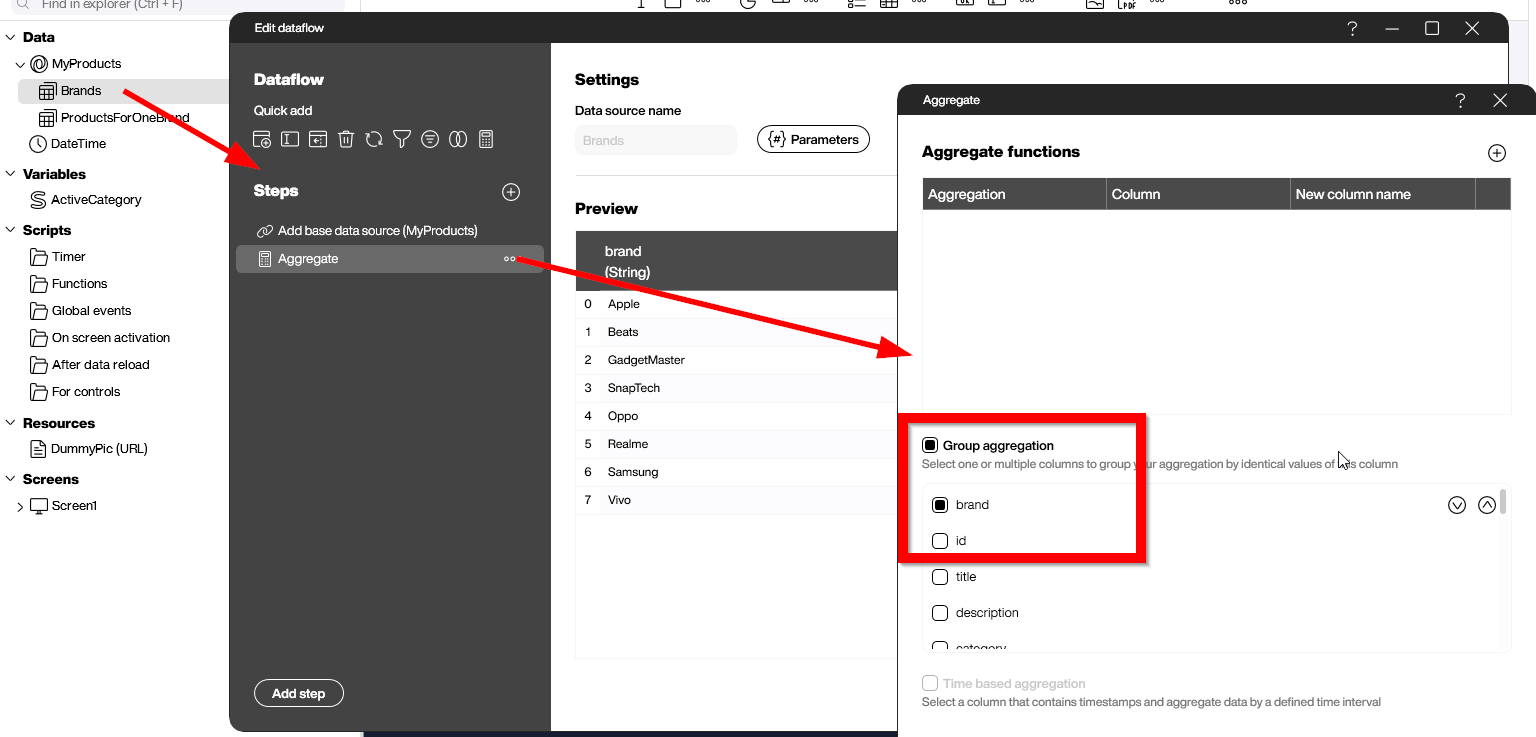
We will process the data through a data flow that aggregates the data by the brand group. The result set will be a list of distinct brand values.
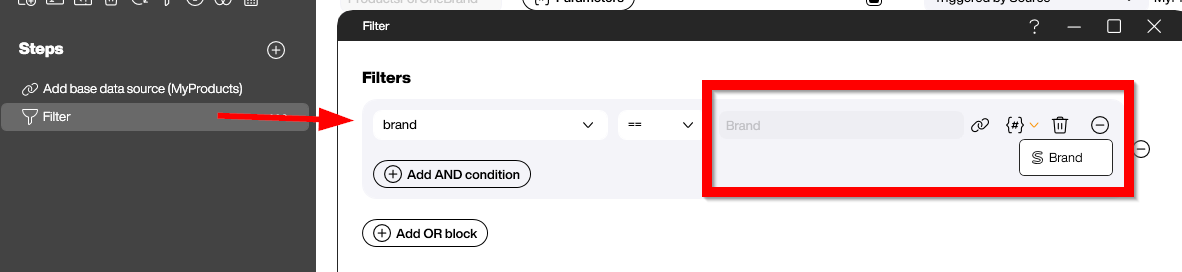
For the second data flow, we will use the new feature of parameterized data flows. Through the Parameters button, we can define Brand as a parameter.
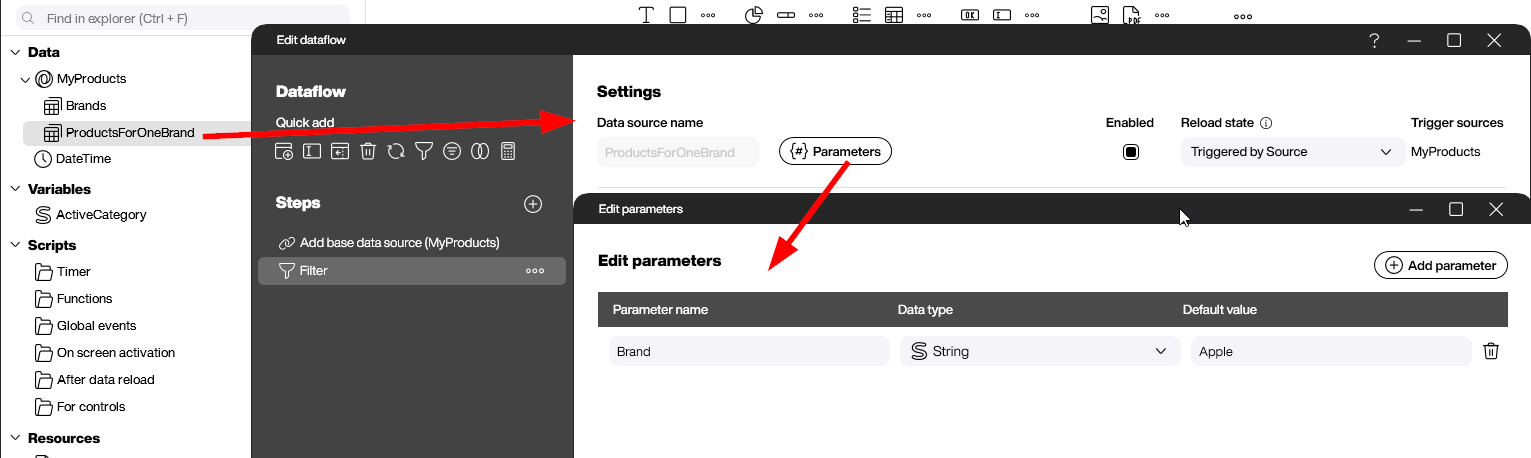
We then use this parameter in a filter step to filter the product rows for the given brand.
Preparing the UI
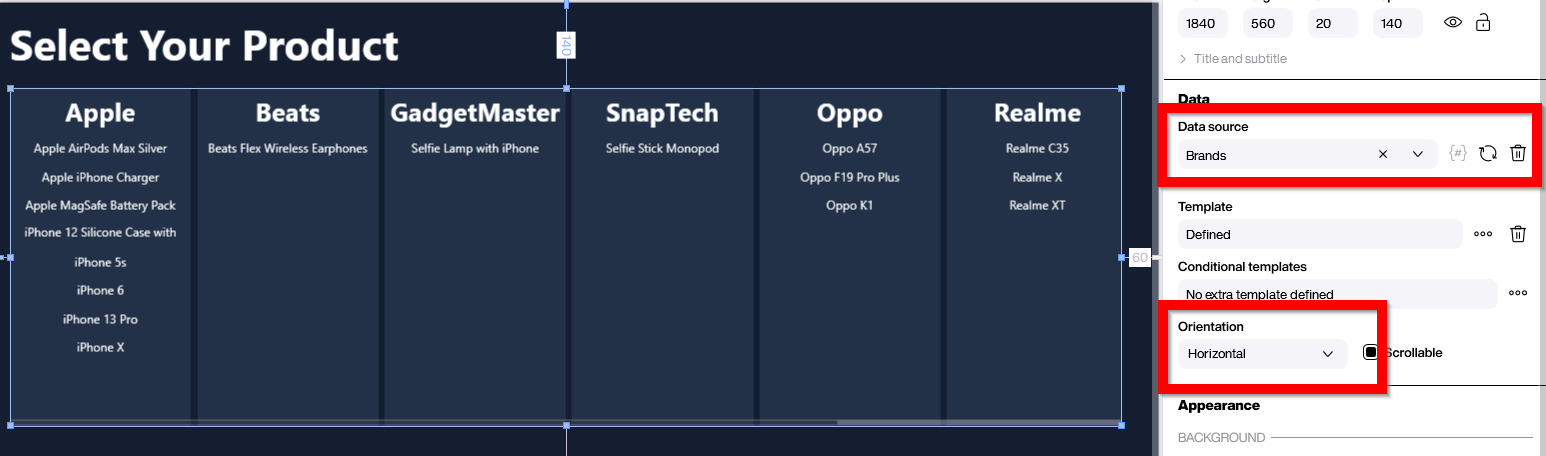
The foundation of our two-dimensional data presentation is a styled list. The styled list has a horizontal orientation and is bound to the Brands data flow. This gives us one column for each brand.
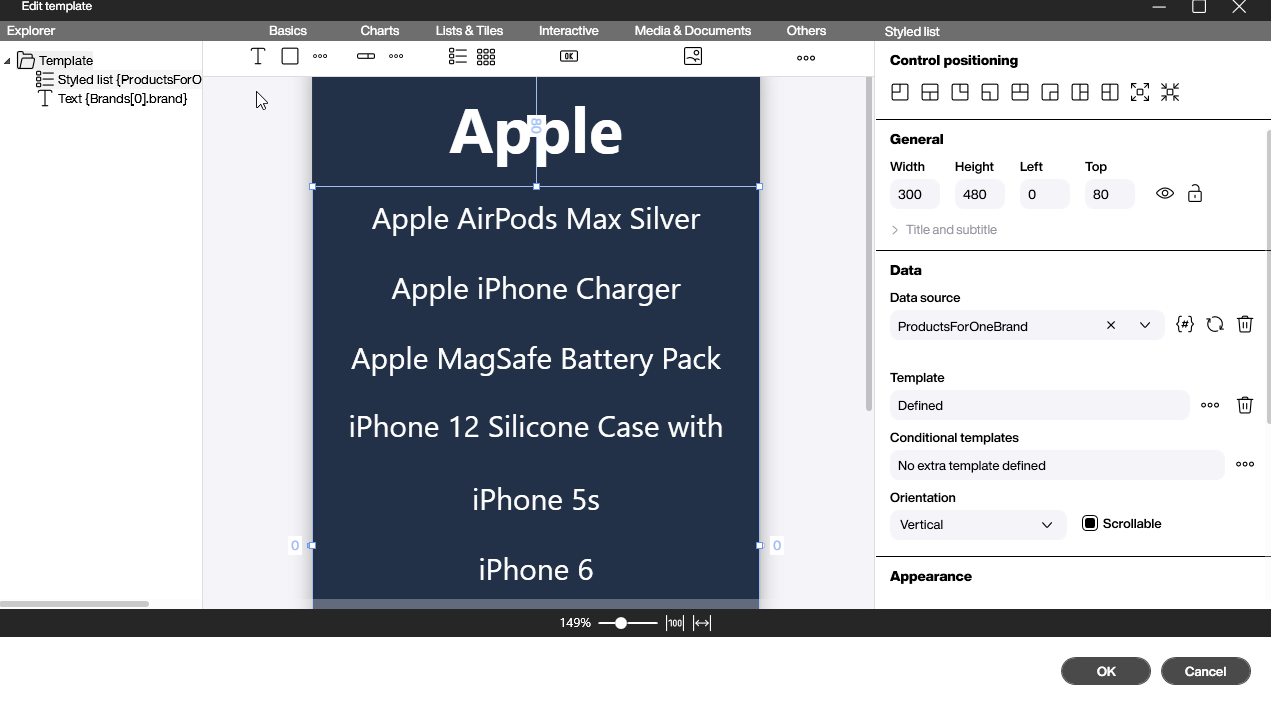
Now comes the key step to add the second dimension. We will place a styled list into the template of the first styled list. The second styled list must be bound to our parameterized data flow ProductForOneBrand.
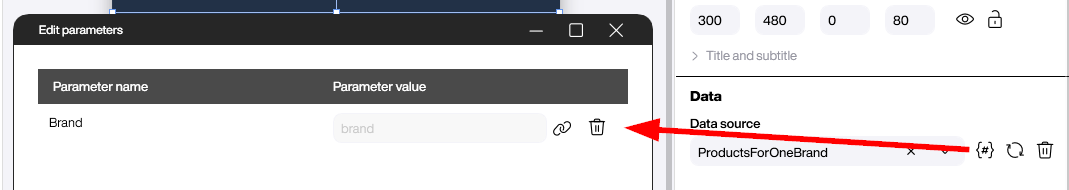
The input parameter for the parameterized data flow is bound to the brand column of the first dimension.
Result and Conclusion
This example demonstrates how to build a two-dimensional data representation dynamically. Before parameterized data flows, it would have been necessary to create separate data flows for each brand. That’s not only tedious but also not dynamic, meaning we need to know the existence of each brand in advance. If the brands are completely unknown during design time, parameterized data flows are the only way to achieve this.