In this article, we will learn how to use lists in Peakboard Hub Online (PBHO). We will learn how to write data to a list, how to read data from a list, and how to aggregate data from a list. The data we will use is sensor data from an air conditioner.
Here is an overview of the steps we will take:
- Create a new list in PBHO.
- Create a data source for our air conditioner sensor data. We learned how to do this in a previous article.
- Create a data source for our PBHO list. This will let us write to and read from the list.
- Create a script that writes new sensor data to our PBHO list. Each time new sensor data comes in, this script will execute and write the new data to the list.
- Create a data source that performs data aggregation on our PBHO list, using a SQL query. We will use a SQL query to get the maximum, minimum, and average temperature from our list.
- Add table controls for all three of our data sources to visualize the result.
See this article to learn the basics of PBHO.
You can also download the completed dashboard.
Create a new list in PBHO
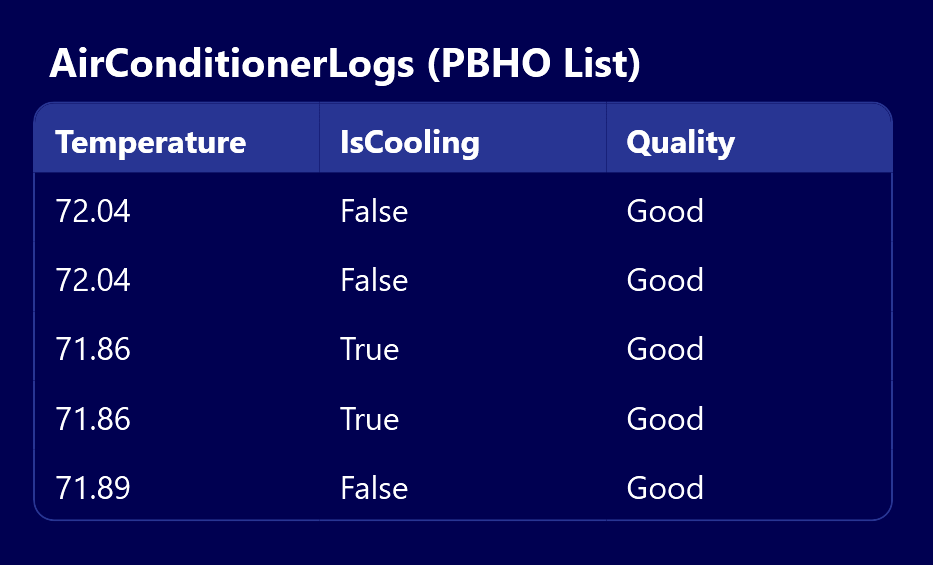
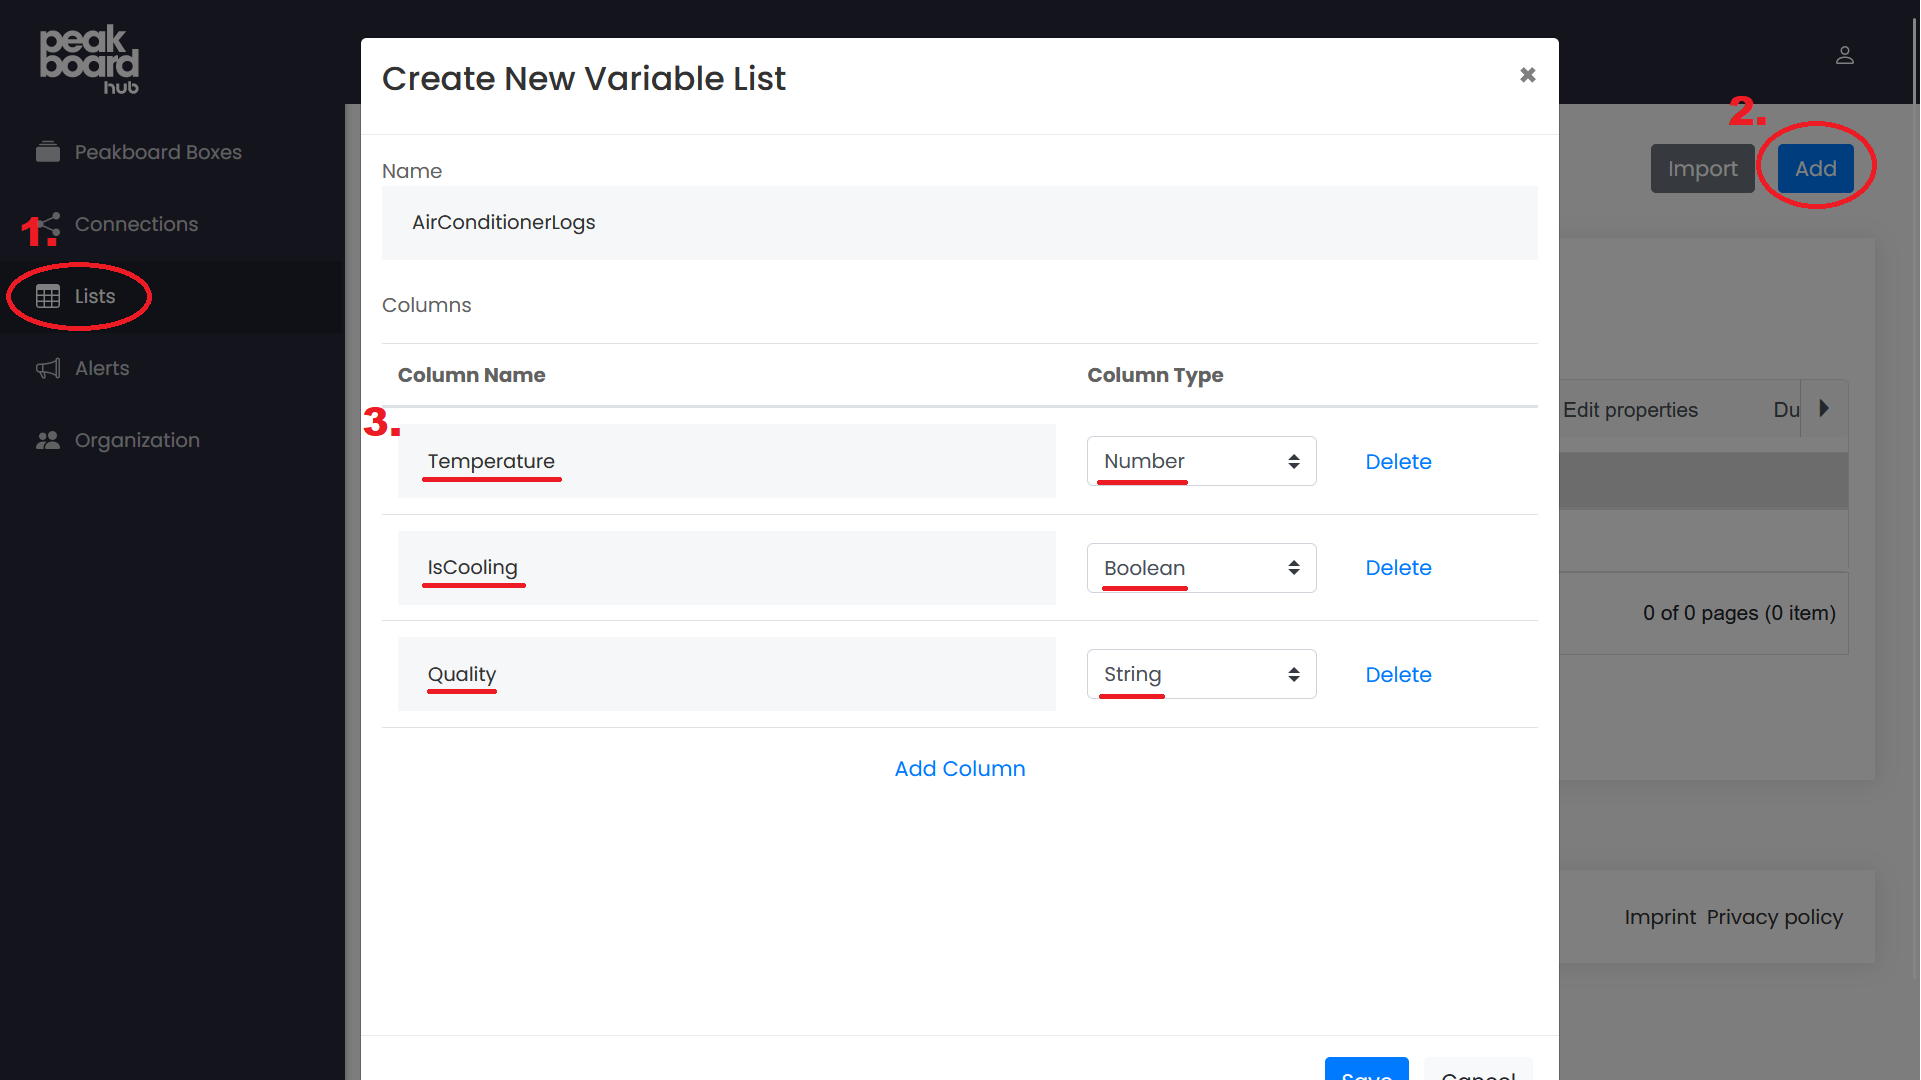
In PBHO, we create an empty list called AirConditionerLogs. We will write our sensor data to this list.
We add three columns, which correspond to the data we will get from the air conditioner:
Temperature(number): the ambient temperature.IsCooling(boolean): whether the air conditioner is actively cooling or not.Quality(string): the air quality.
Create a data source for our sensor data
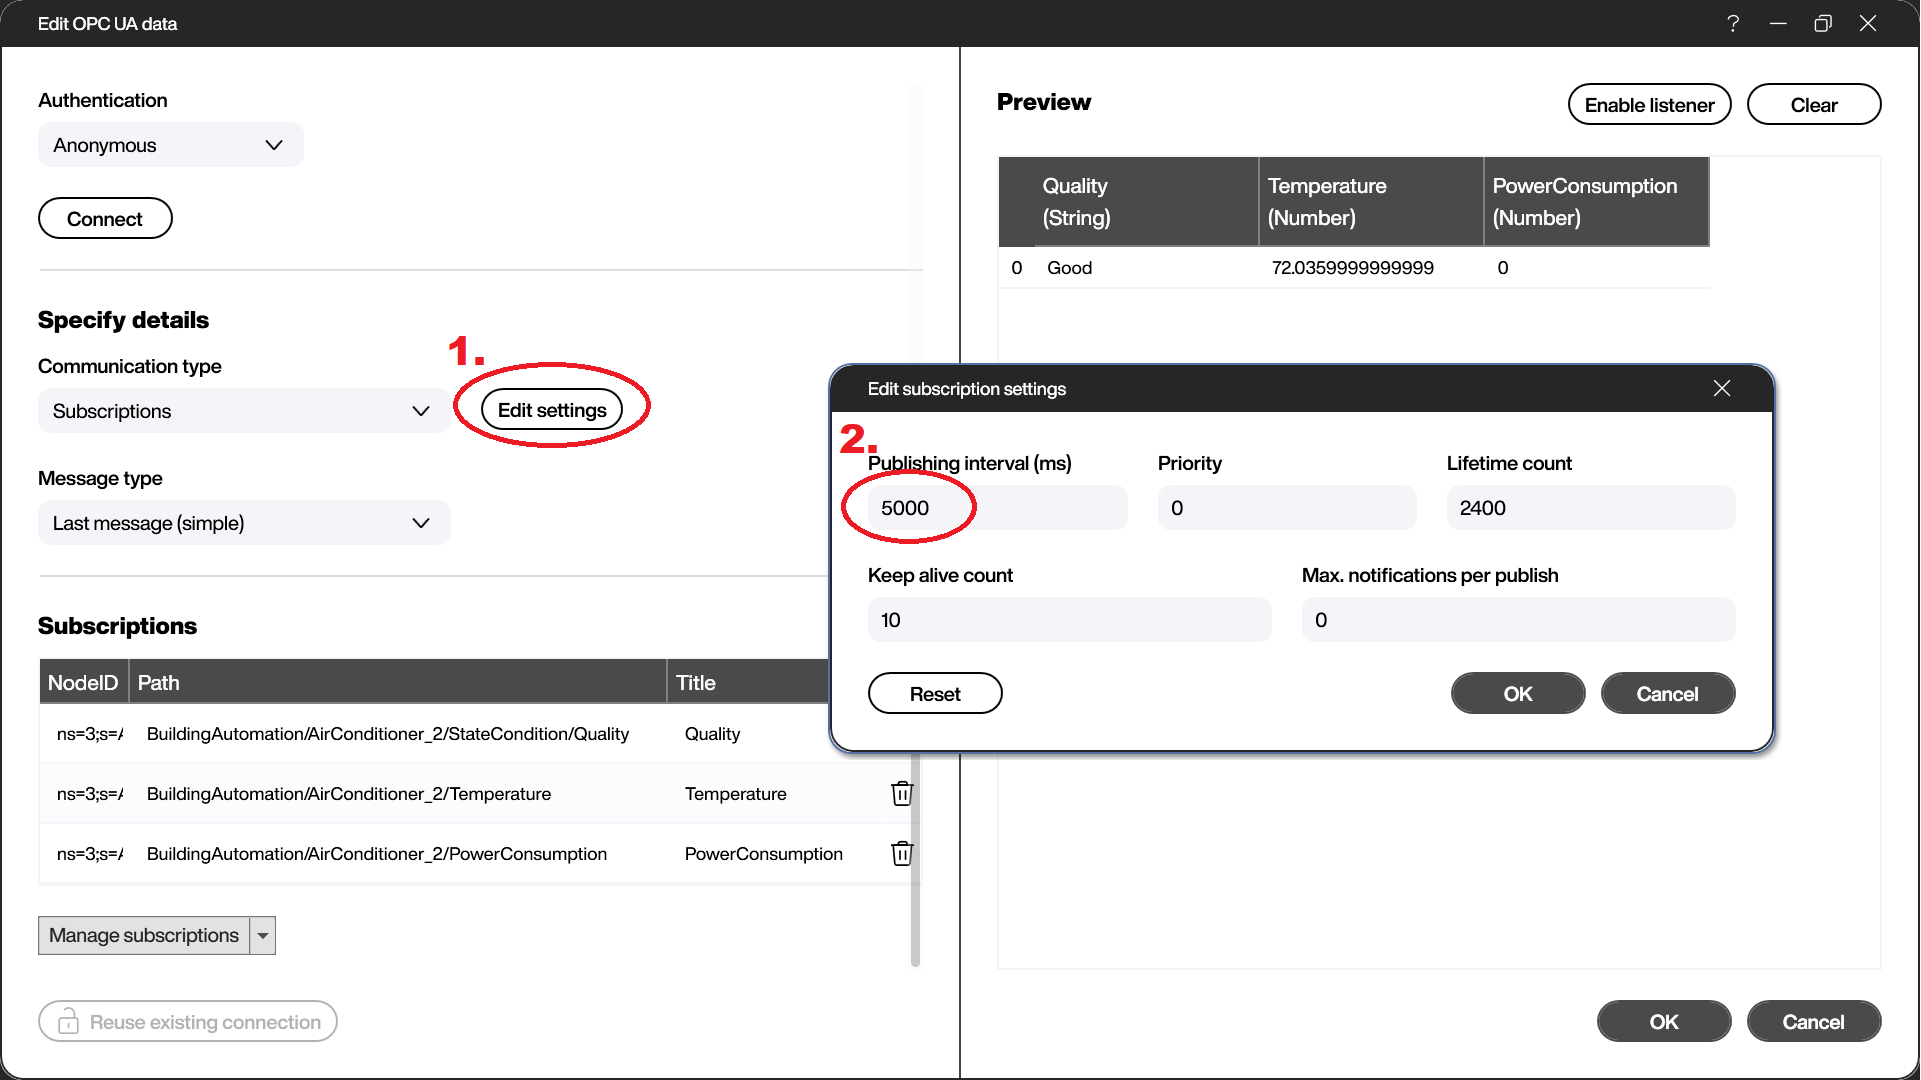
In Peakboard Designer, we add a new OPC UA data source for our sensor data. We call it AirConditionerData.
We subscribe to these three nodes:
Temperature: the ambient temperature.PowerConsumption: the power consumption. We will use this to get theIsCoolingcolumn in our PBHO list, by checking ifPowerConsumpitionis 0.Quality: the air quality.
Finally, we change the polling rate to 5 seconds, to slow it down a bit.
Create a data source for our PBHO list
In Peakboard Designer, we add a new PBHO list data source. We call it AirConditionerLogs. Our Peakboard Box will use this data source to read from the PBHO list.
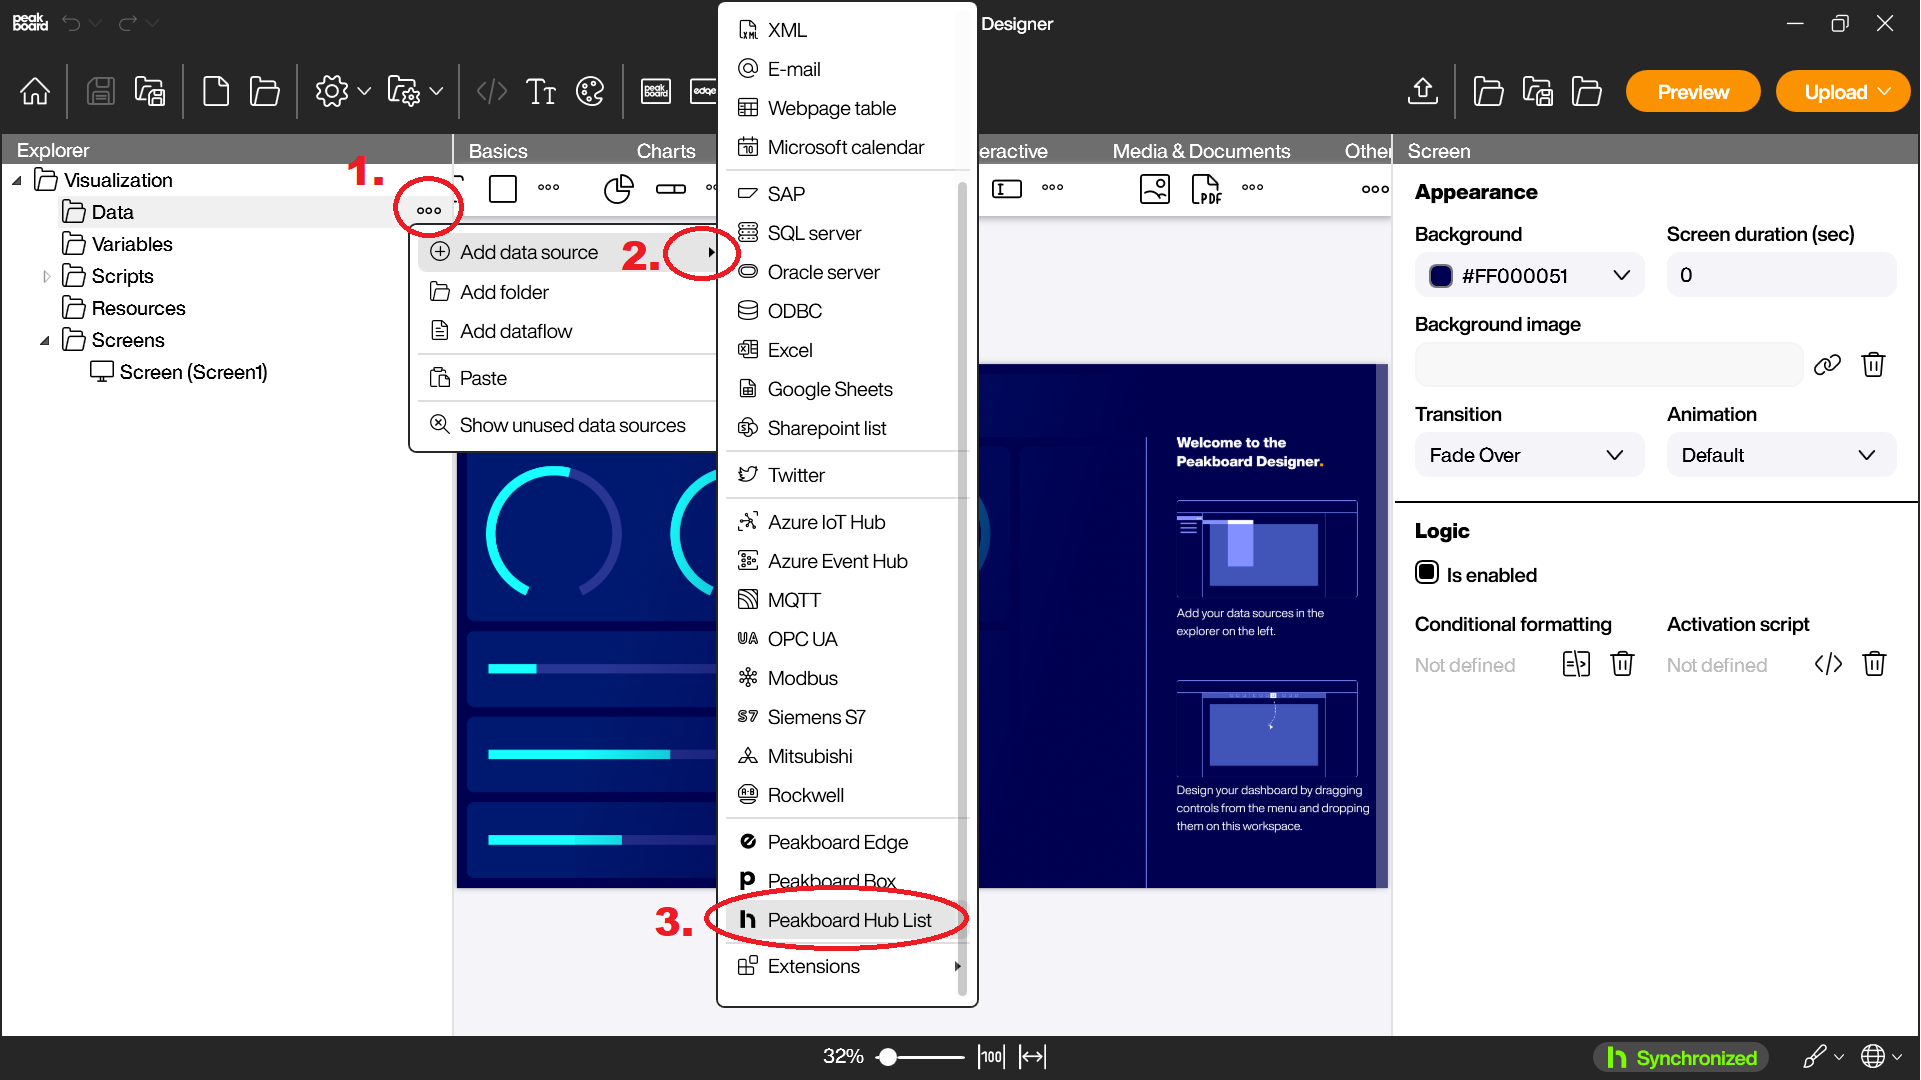
Here’s how we set up this data source:
- We set the reload state to On Startup. Later on, we will have a script handle the periodic reloading.
- We click Load lists to load all the lists that are available in PBHO.
- We select
AirConditionerLogs. - We sort this data source by
ID, in descending order. This gets us the newest rows first. - We set 5 as the maximum number of rows to fetch, since we’ll only display 5 at a time in our table control.
- We press Load data to see a preview of our list.
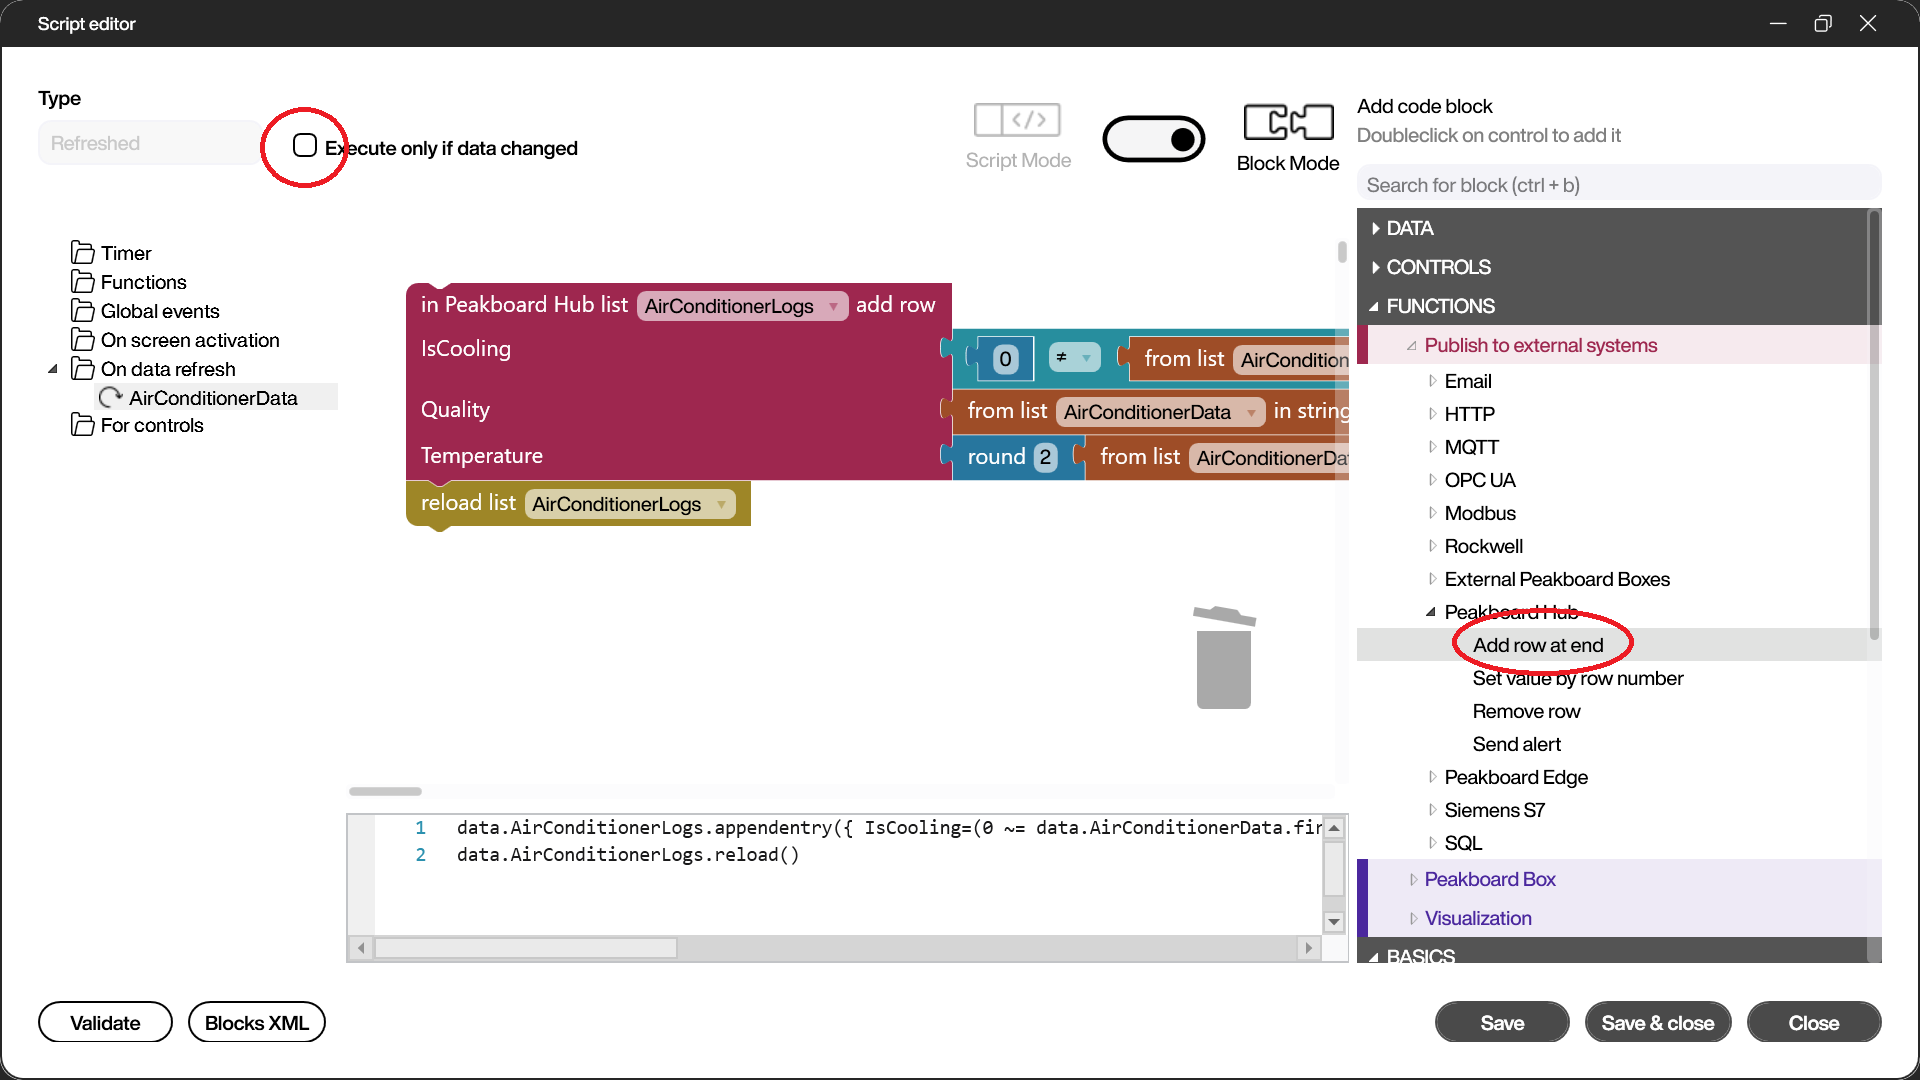
Create a script that writes to our PBHO list
We have a data source for both our sensor data and our list. Now, we can create a script that writes the sensor data to our PBHO list.
First, we create a new refreshed script for AirConditionerData. This script will automatically execute each time AirConditionerData gets new data from the OPC UA server.
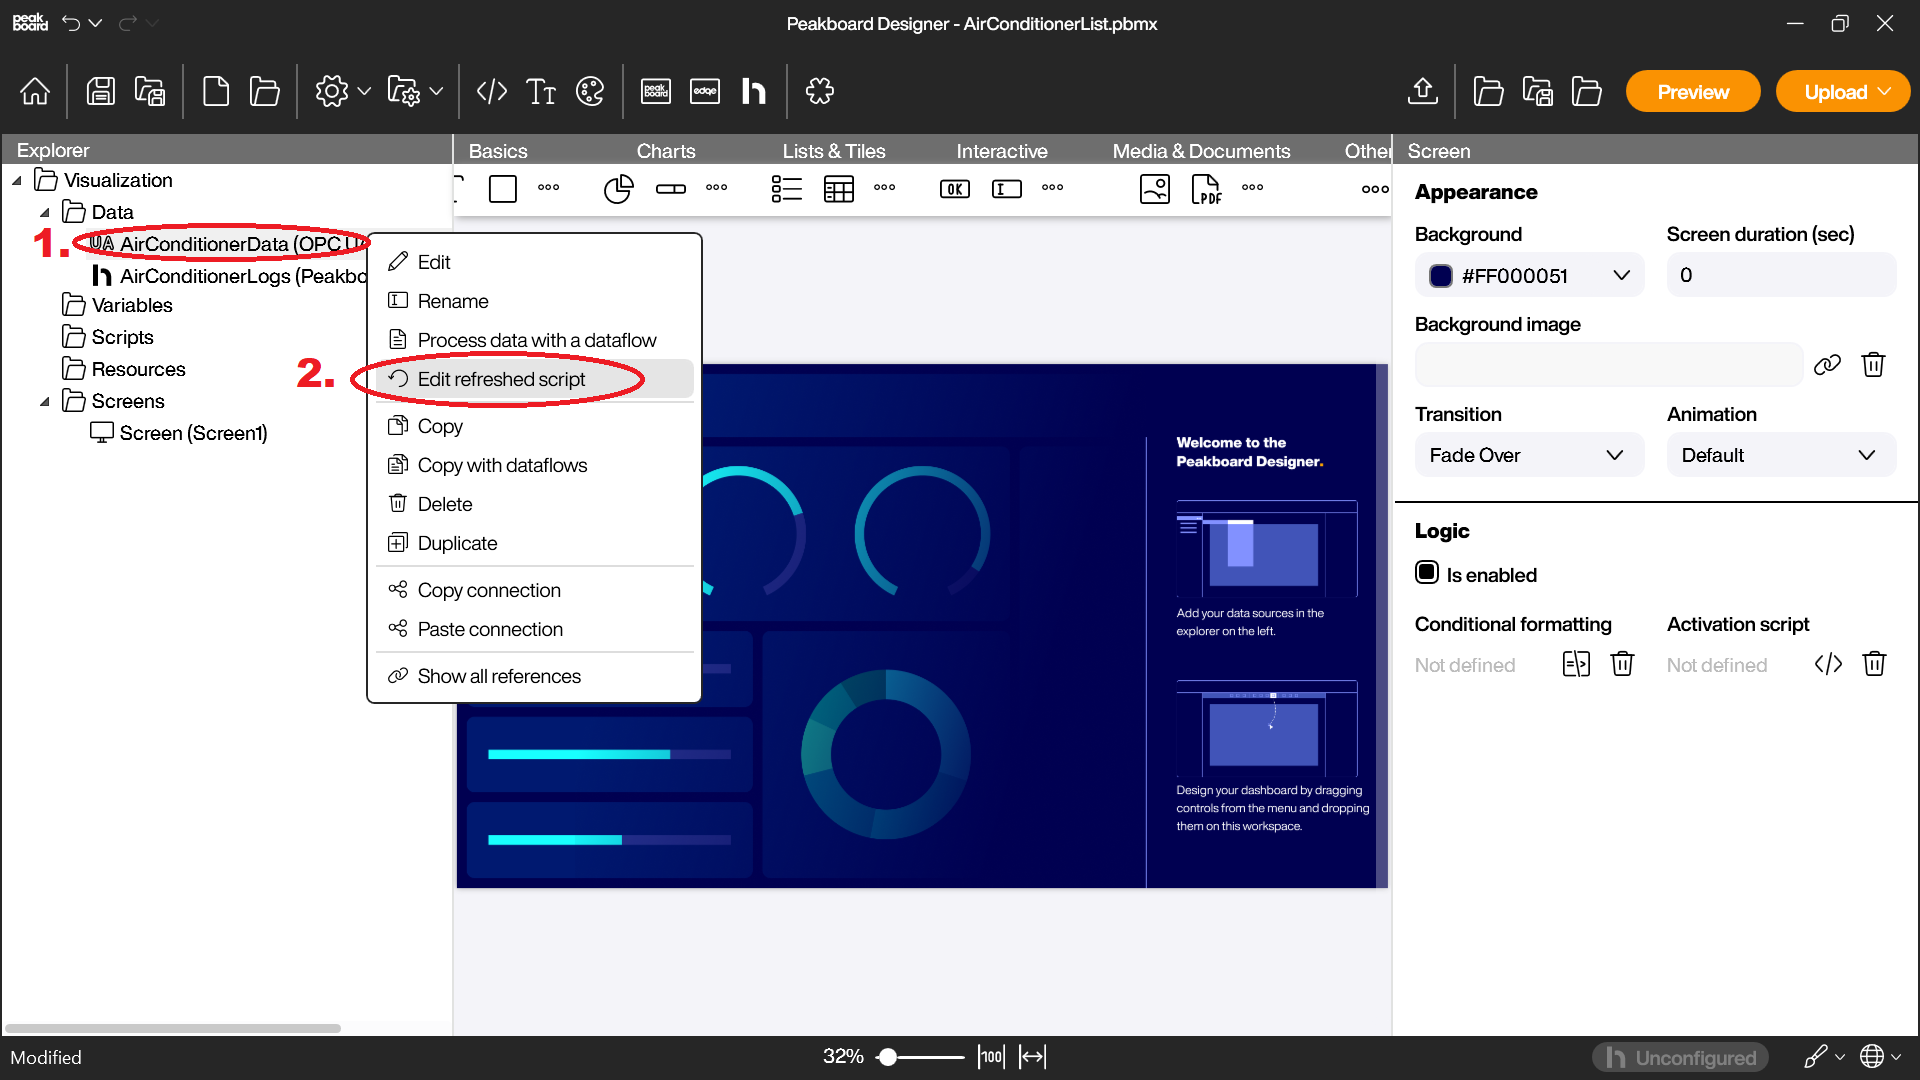
Here is the script that we create:
Each time new sensor data comes in, this script will add a new row to the PBHO list. The columns for this new row come from the columns of the new sensor data. Note that we get IsCooling by converting PowerConsumption into a boolean.
This script also reloads the PBHO list data source at the end, so that our table control will be able to see the changes.
We will also uncheck the Execute only if data changed box. That’s because we want to record all sensor data, regardless of if it changes from the last sensor data we got.
And with that, we have a dashboard that writes the sensor data to the PBHO list, and also reads from that list. But before we add controls to visualize everything, let’s try to do some data aggregation.
Use SQL on PBHO lists
The problem
Let’s say we want to do some data aggregation on our list: we want to get the maximum, minimum, and average temperature. How can we do this?
Here’s one way we could do it:
- Remove the row limit we had in
AirConditionerLogs, so that the entire data set is available to us. - Create a new dataflow on
AirConditionerLogsthat uses the Max, Min, and Average aggregate functions.
But this method has a few downsides. First, it downloads the entire list into our Peakboard Box, and the list can be quite large. Second, it requires our Peakboard Box to run calculations on the entire list, which again, can be quite large. Neither of these things are ideal.
The Solution
Luckily, we can have PBHO do the data aggregation for us, and just give us the results. That way, our Peakboard Box doesn’t have to do any of the calculations itself, and it only needs to download three numbers (the results). Here’s how we do this.
We create a new PBHO list data source called AirConditionerLogsAnalysis. We click Load lists, like before. But this time, we will click Select with SQL and enter the following SQL query:
SELECT
  ROUND(AVG(Temperature), 2) AS AvgTemp,
  MAX(Temperature) AS MaxTemp,
  MIN(Temperature) AS MinTemp
FROM
  AirConditionerLogs
The table name is the name of our PBHO list: AirConditionerLogs.
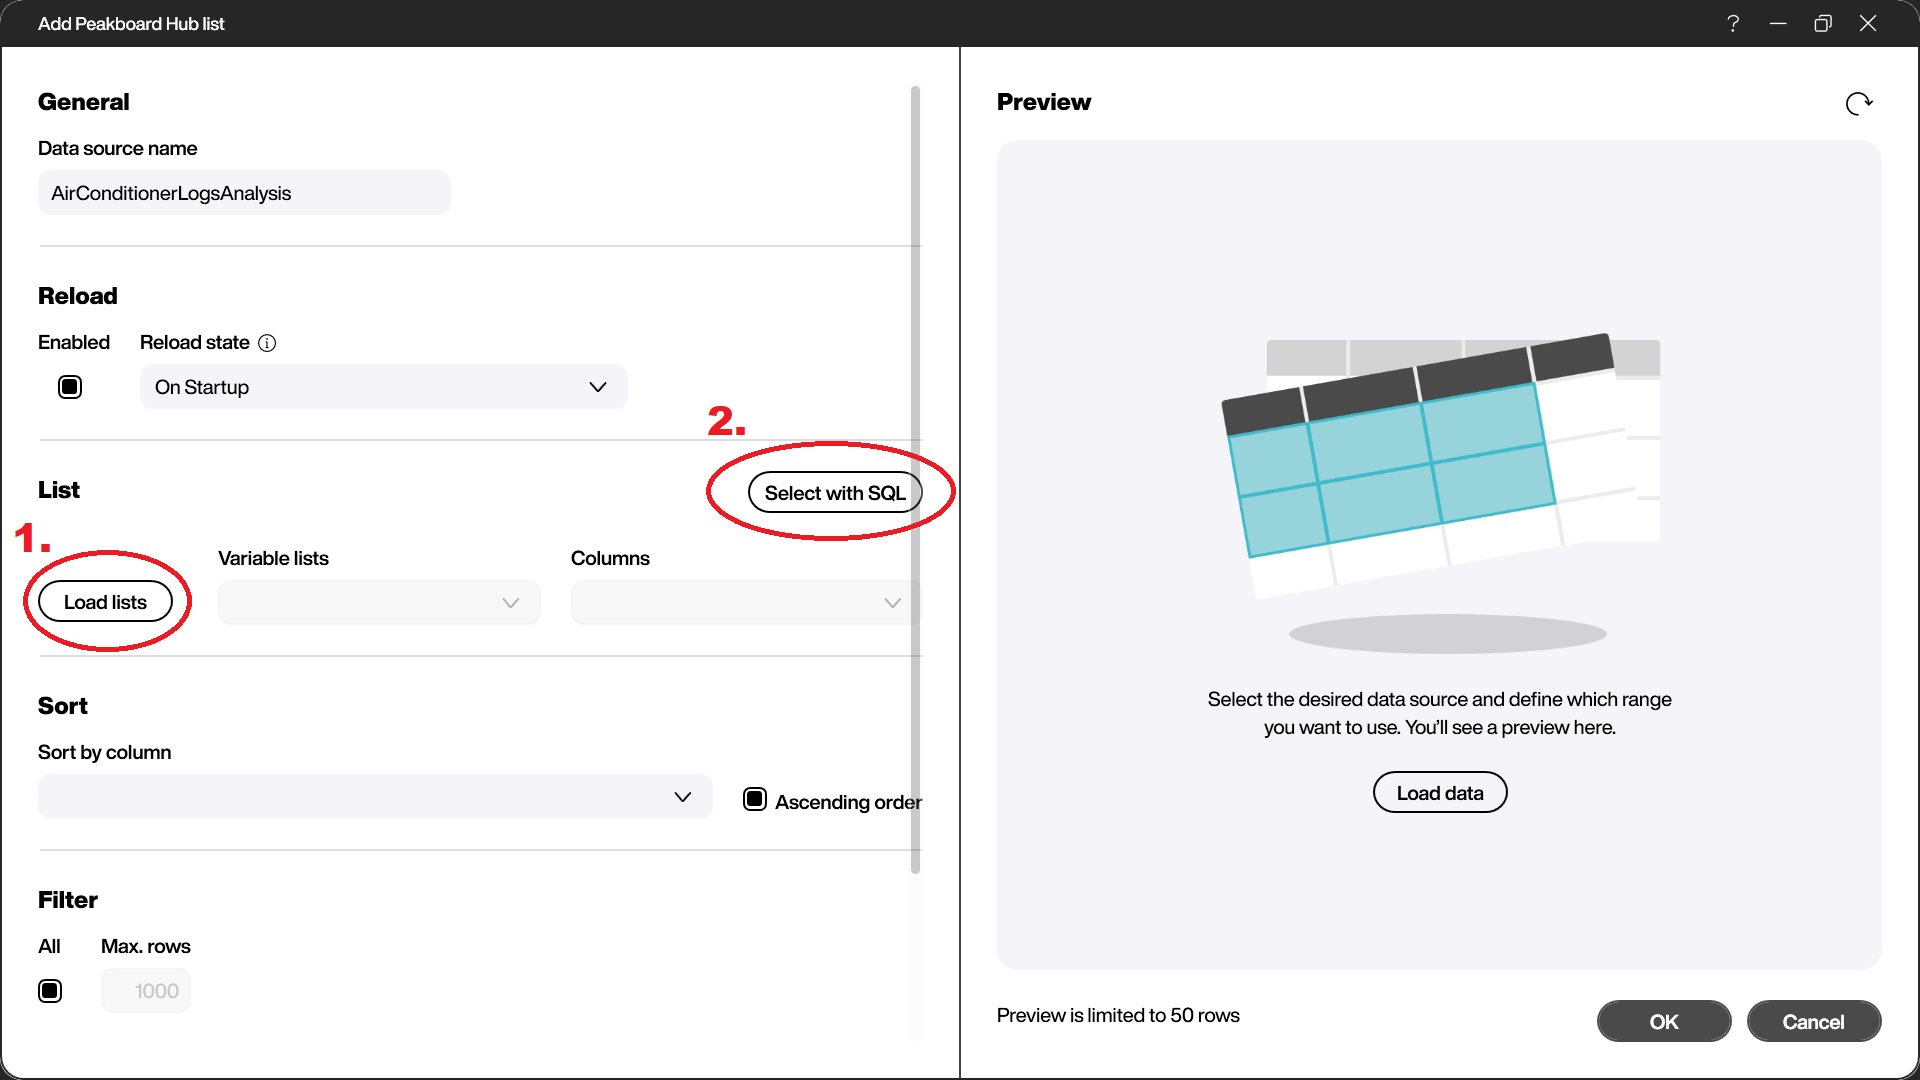
In our script from before, we also need to append a block that reloads AirConditionerLogsAnalysis.
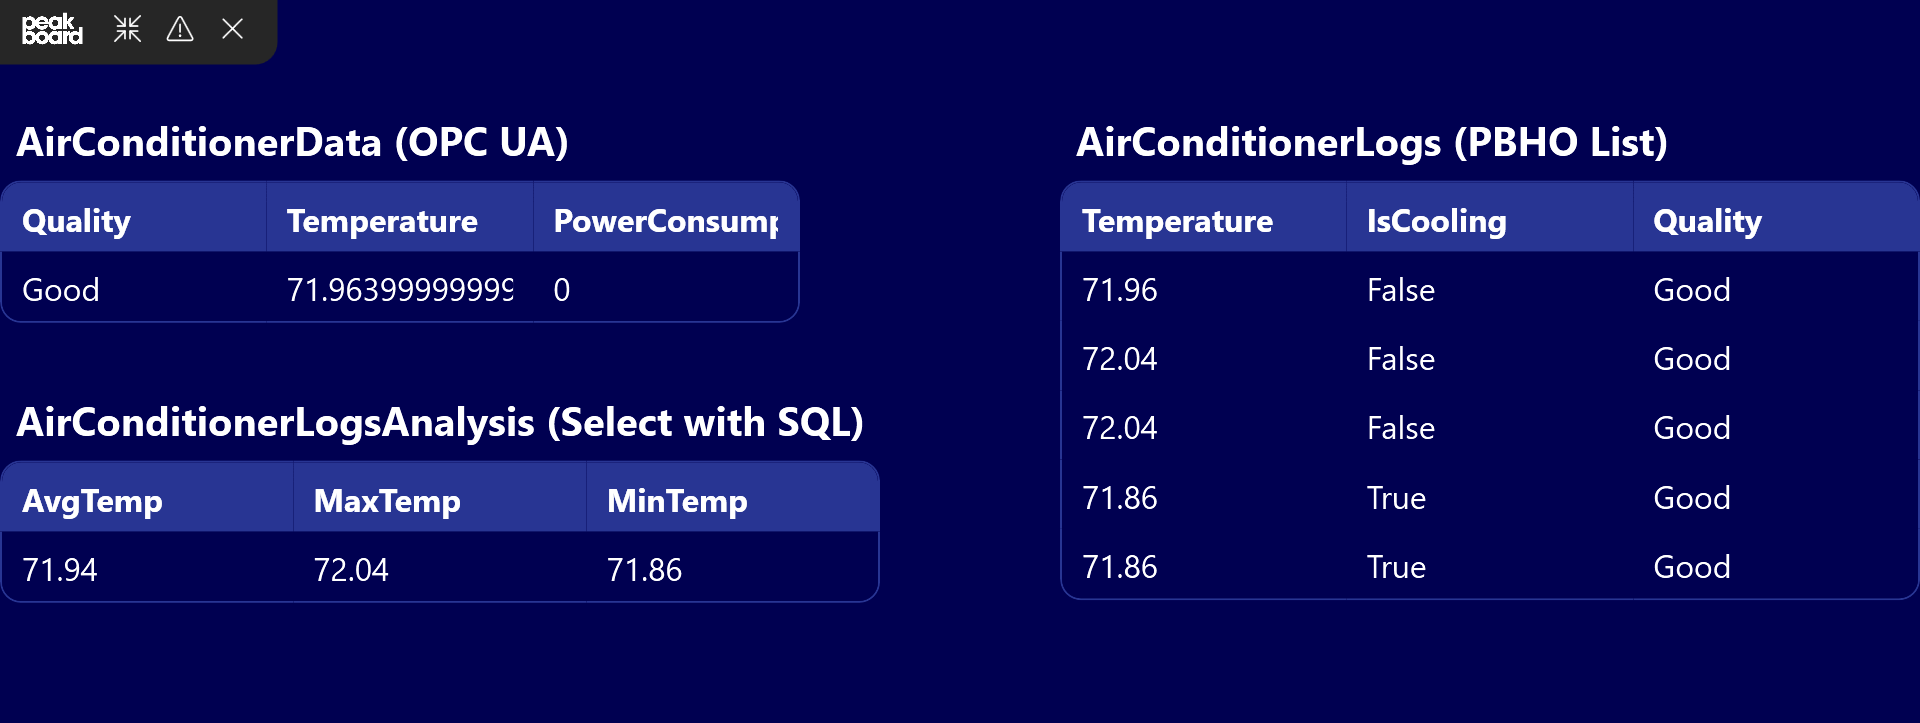
Add table controls
After adding some table controls, here’s what the final product looks like: