OPC UA may be a complicated topic, but if you’re new to OPC UA, this article is the perfect starting point. Minimum requirements except for having the Peakboard Designer installed: Nothing! You can start right away, because we’re using an OPC UA server that is available to the public.
Check out opcuaserver.com to find out more about publicly available servers. The one we’re using is opc.tcp://opcuaserver.com:48010.
Find the downloadable PBMX here.
Setting up the server connection
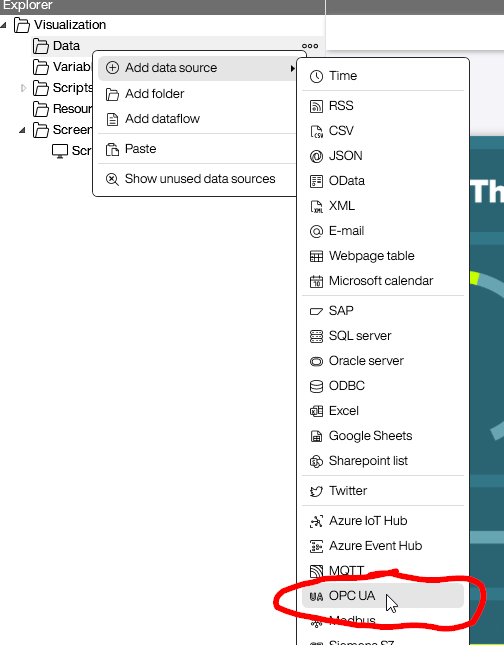
In the Peakboard Designer, create a new OPC UA data source.
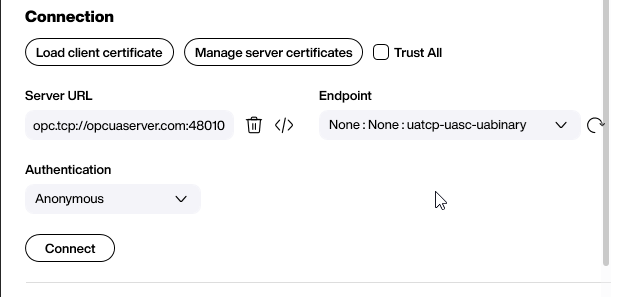
Enter a name and the URL mentioned above (opc.tcp://opcuaserver.com:48010), and click on the refresh button to get the endpoints. Why are there several endpoints? Because the server offers different types of security. You can use it with or without authentication, and with different levels of encryption. We use the simplest, which is just “None,” and we also leave the authentication setting on “Anonymous.”
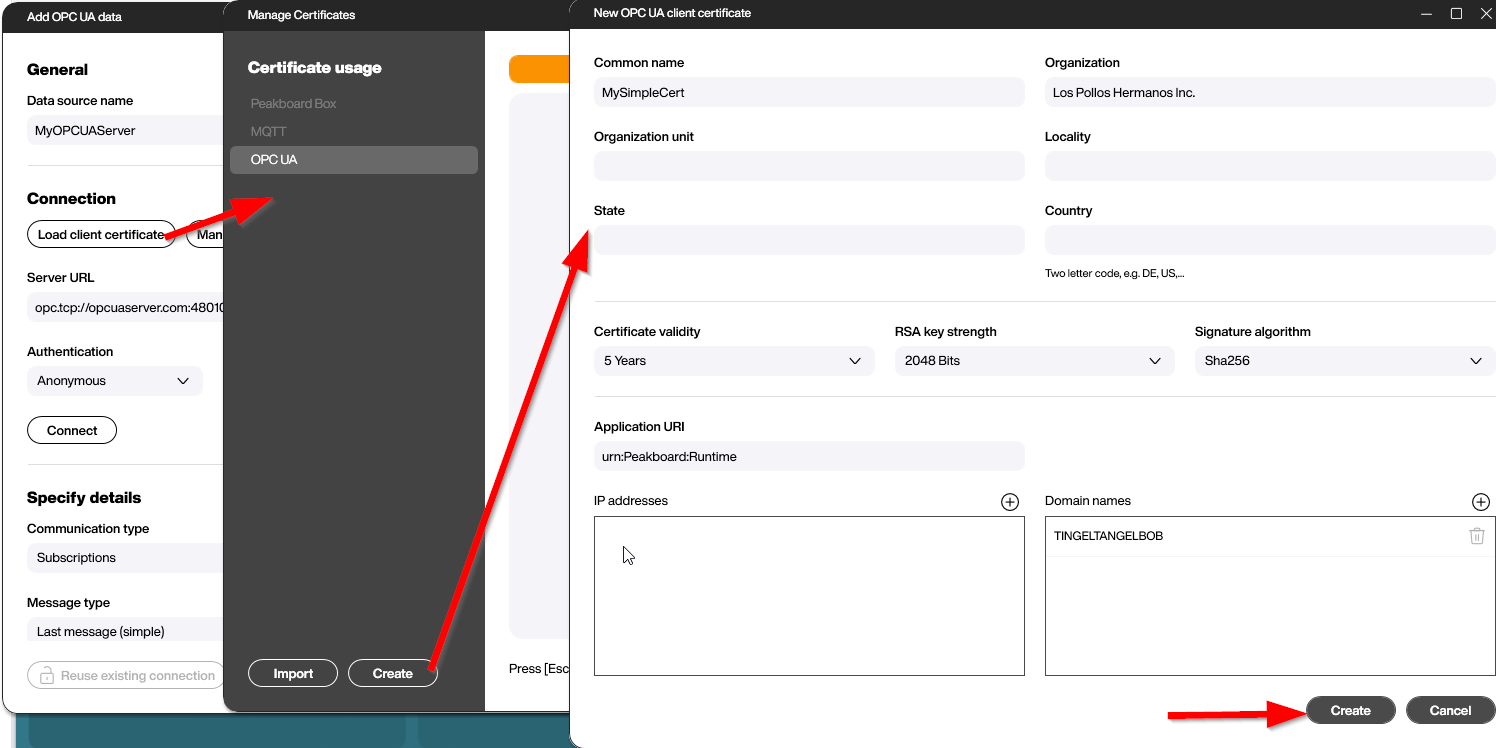
Before we can connect to the server, we need a certificate to identify ourselves. If you don’t have one, that’s not a problem; you can easily create one. Just click on “Load client certificates,” then “Create,” and then fill out the basic information. Finally, click on “Create.” And that’s it.
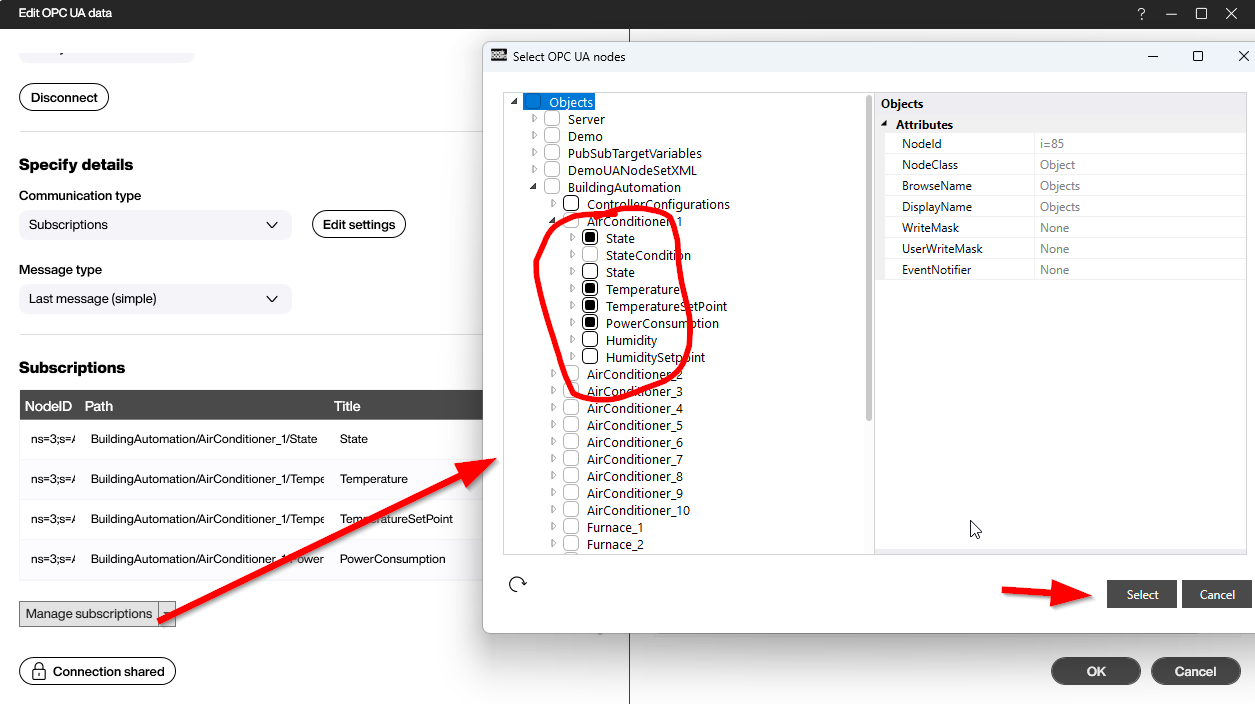
Hit the “Connect” button to check the connection. Then, click on “Manage Subscriptions.” If everything works, you should see a hierarchy of nodes. Every OPC UA server offer these nodes, which represent a set of hierarchically organised data points. Feel free to browse the hierarchy. This demo server offers all kinds of demo data with different data types to experiment with.
For our example, we browse the hierarchy and find a couple of AirConditioner_X nodes. These represent real A/Cs with certain attributes. State says if the A/C is turned on or off, Temperature is the actual temperature, and TemperatureSetPoint represents the temperature that the A/C is set at. The last attribute we’re interested in is PowerConsumption. If this attribute is greater than zero, then the A/C is doing actual cooling. Select these attributes and return to the main dialog.
Now, you can try to get some real values from the server. Just click on “Enable listener” and see the numbers flow in. The actual temperature updates every couple of seconds. And as soon as the temperature rises above the temperature set point, the power consumption goes up, because the A/C will start working to cool things down again.
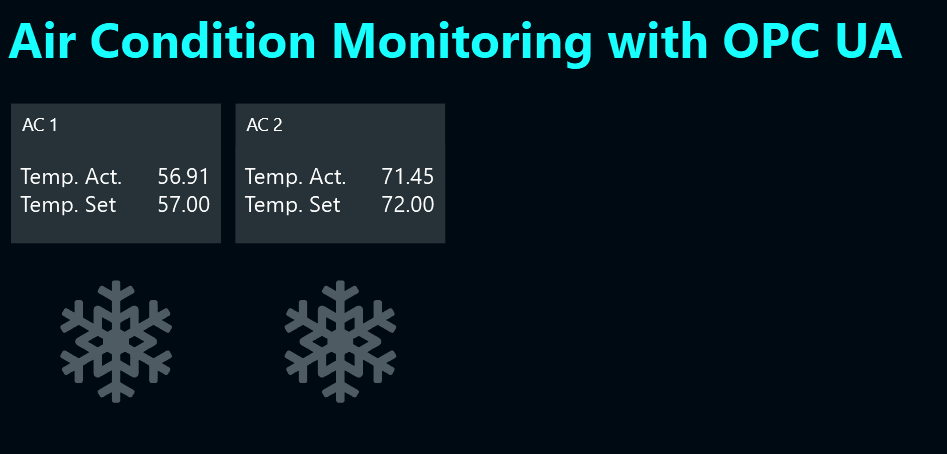
Now we can start to actually use the data. You can understand the details of the dashboard yourself by downloading the PBMX. It use some tiles to present the data. The dashboard also has a second A/C (same pattern, just different nodes) and also has an icon control that changes its color with the help of conditional formatting (no scripting). Check out this article to find out more about Conditional Formatting. Every time the power consumption goes up (actual cooling), the snowflake turns into a bright color.
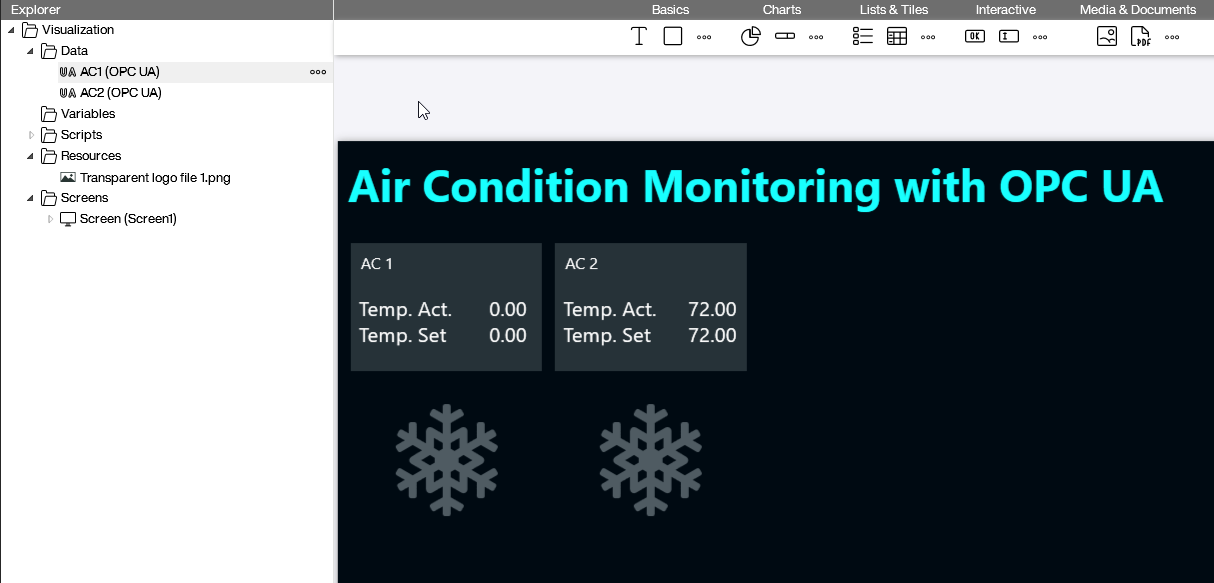
And here’s how it looks like in real life.