This article covers a common use case when using MS Graph API with Peakboard: accessing and processing calendar event data. We will also learn how to use the $filter parameter in the Graph API.
Please make sure to read through the basics of using MS Graph API in Peakboard: MS Graph API - Understand the basics and get started
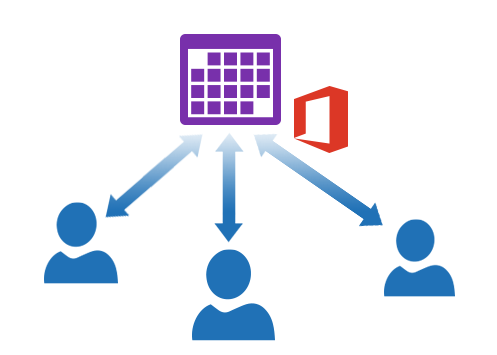
Office 365 comes with a lot of calendars (i.e. different varieties of personal and potentially shared calendars). This article covers a group of calendars that are typically shared by a whole company or at least shared by a team.
Please note that a group calendar is typically not used to reflect the events of resources, like a meeting room. That artefact is called a “room” and is queried differently. See this article to learn more about accessing room calendars with Peakboard.
The API calls
Our goal is to construct an MS Graph API call that returns the events of the group calendar. But in order to do that, will first need the ID of the group.
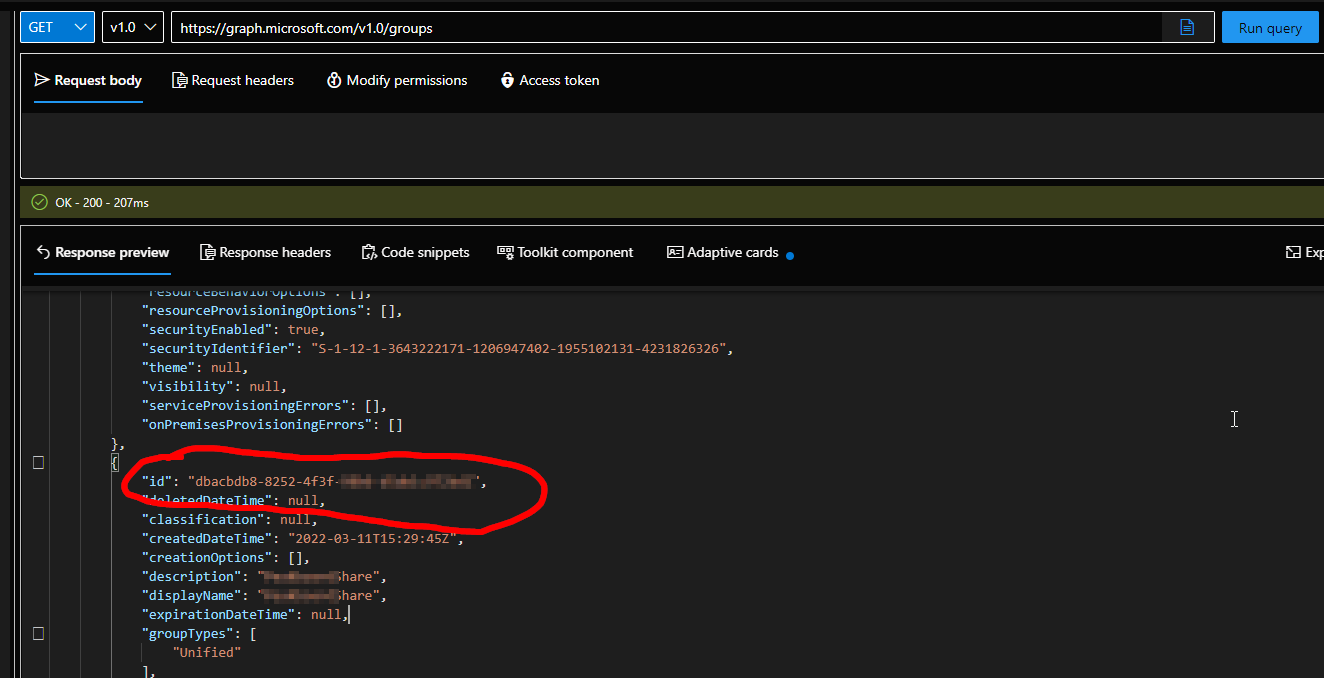
We can find this group ID by calling the API. This endpoint will list all the available groups in the tenant:
https://graph.microsoft.com/v1.0/groupsAs it’s not necessary to repeat this call, we can just call the API with the Graph Explorer and copy the ID.
Now, we use the ID to form the second call, which gives us the calendar events:
https://graph.microsoft.com/v1.0/groups/dbacbdb8-8252-4f3f-98b6-d5ab1c972bd1/calendar/eventsThis events API offers additional filters (see the “Read more” section at the bottom of this page for links to relevant documentation). We add a filter to get only the events that take place after today. After all, we don’t want events that are from five years ago.
https://graph.microsoft.com/v1.0/groups/dbacbdb8-8252-4f3f-98b6-d5ab1c972bd1/calendar/events?$filter=start/DateTime gt '2023-06-01T00:00:00Z'Building the dashboard
Now, we build our dashboard in Peakboard Designer.
Adding the data source
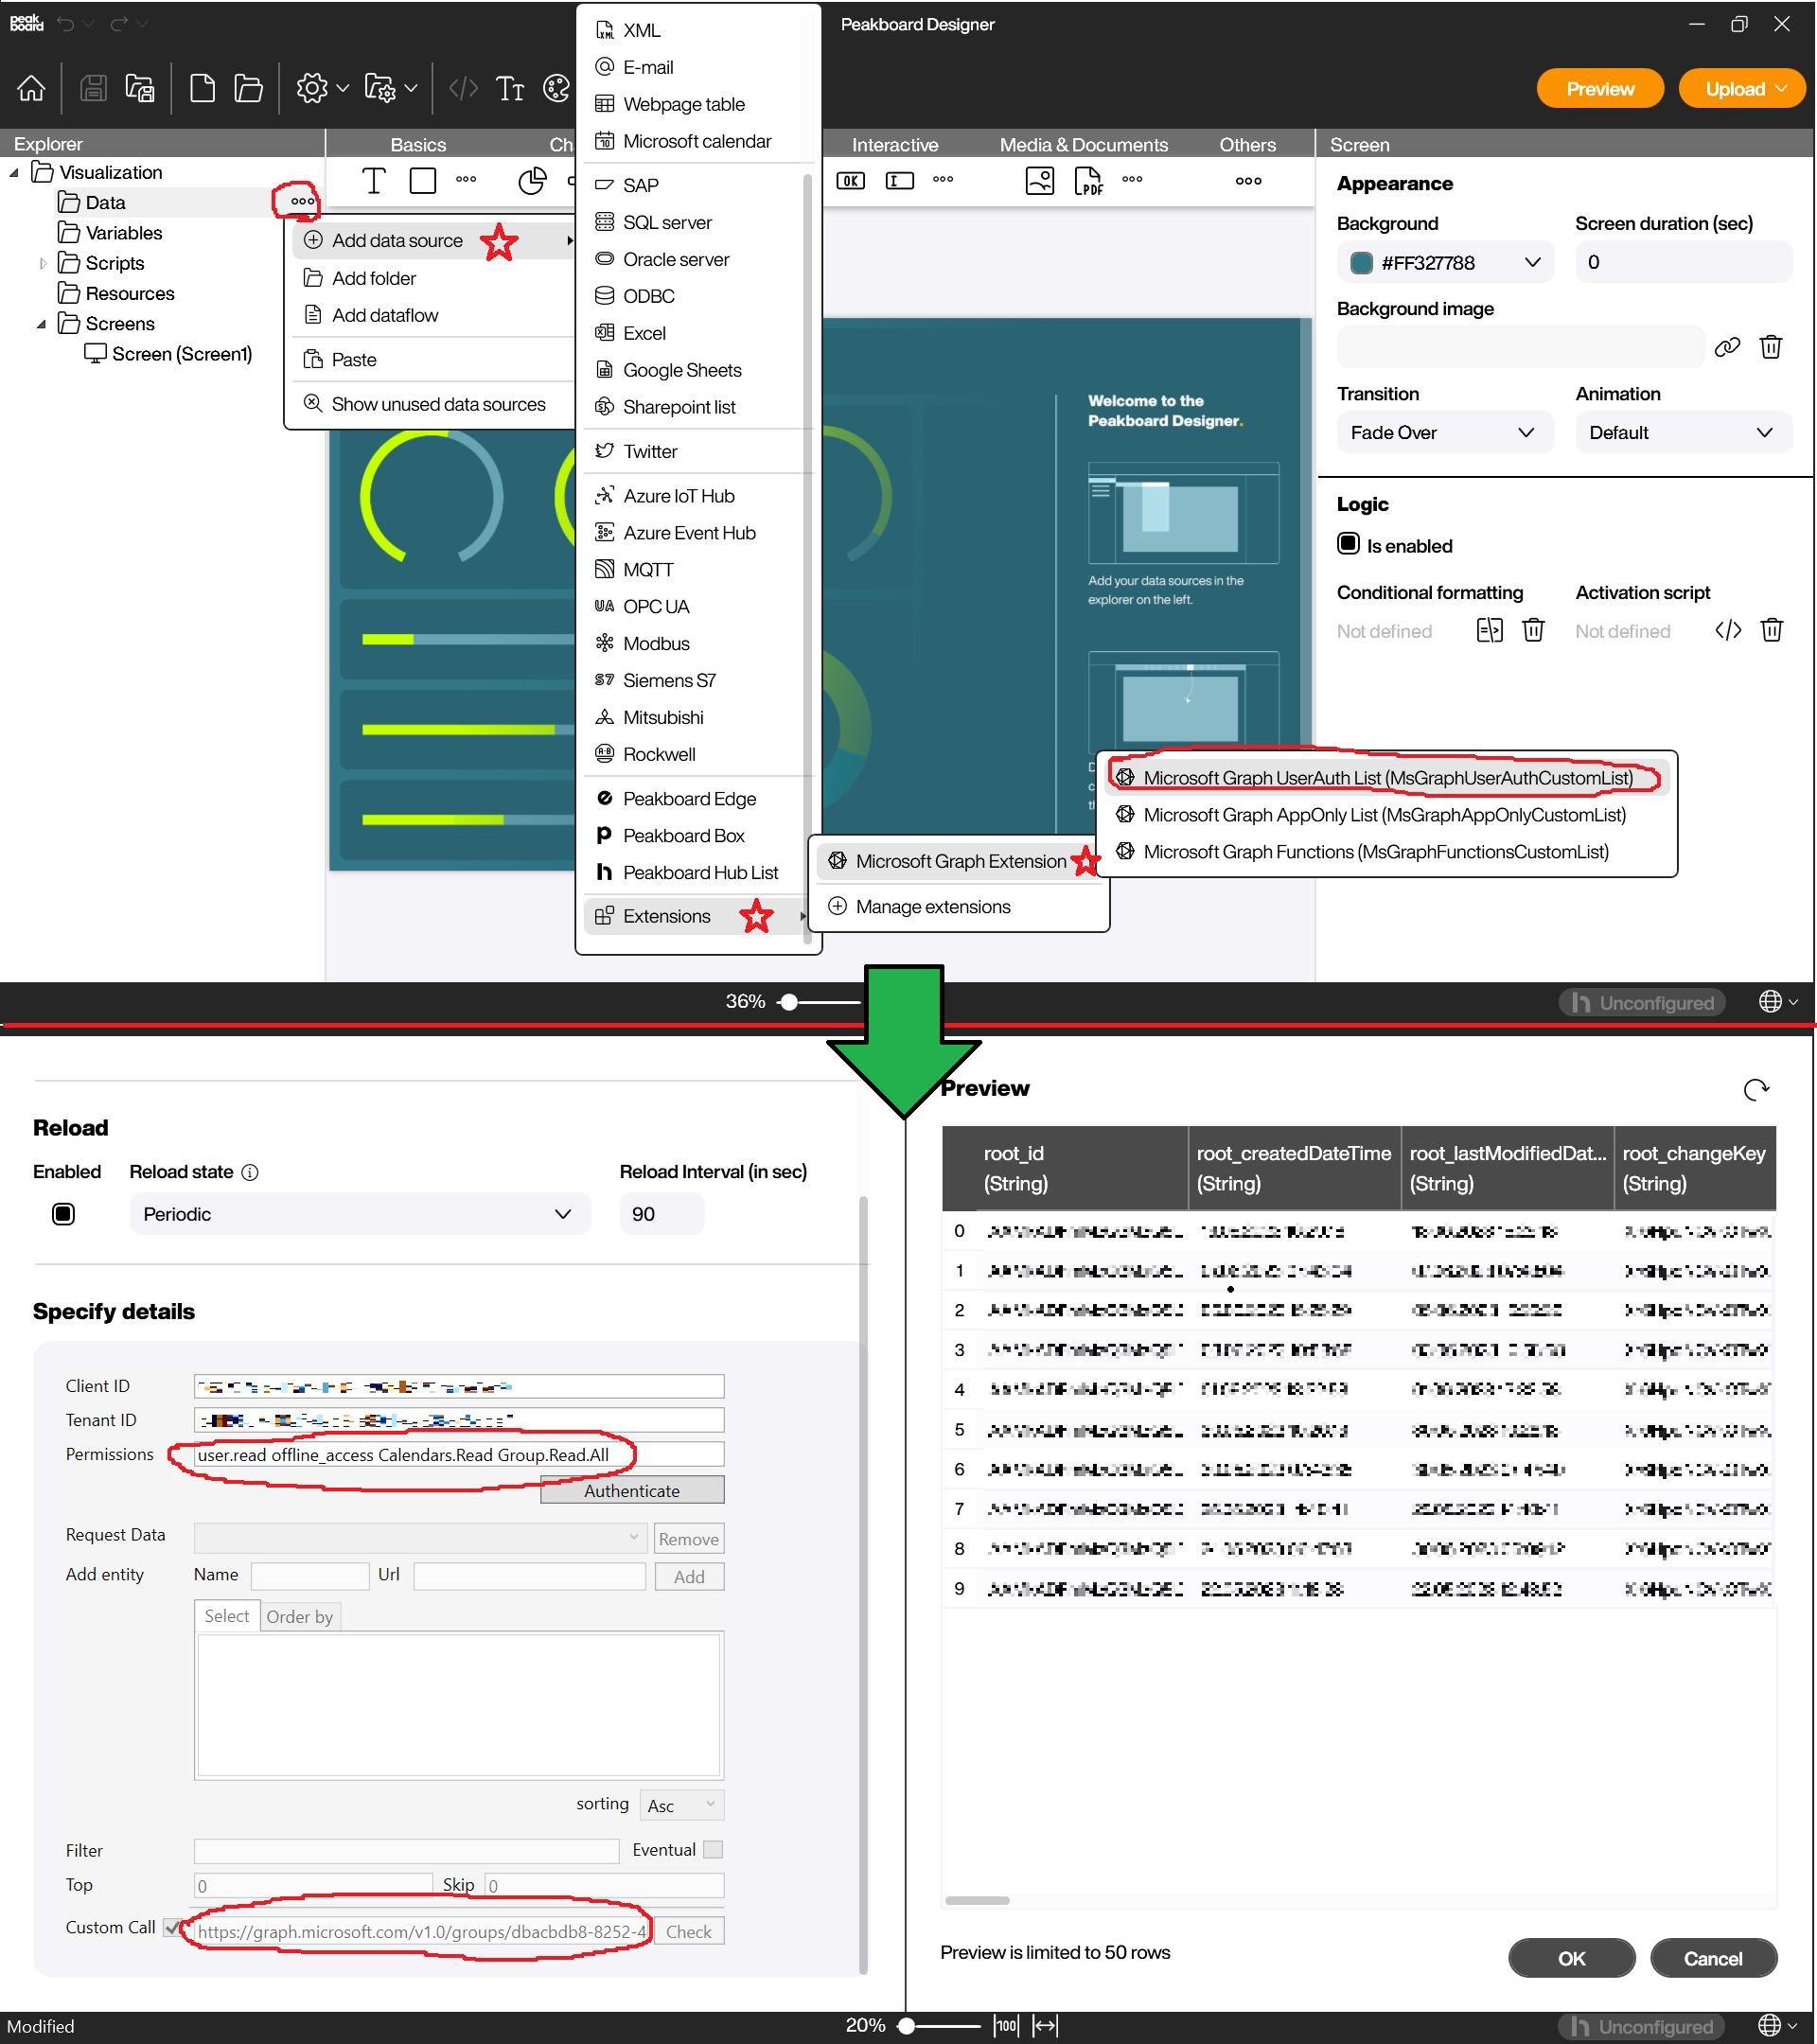
The first step is to add our data source. We create a new “Microsoft Graph UserAuth List” data source.
We set “Permissions” to user.read offline_access Calendars.Read Group.Read.All.
Then, we set “Custom Call” to the API call we created earlier.
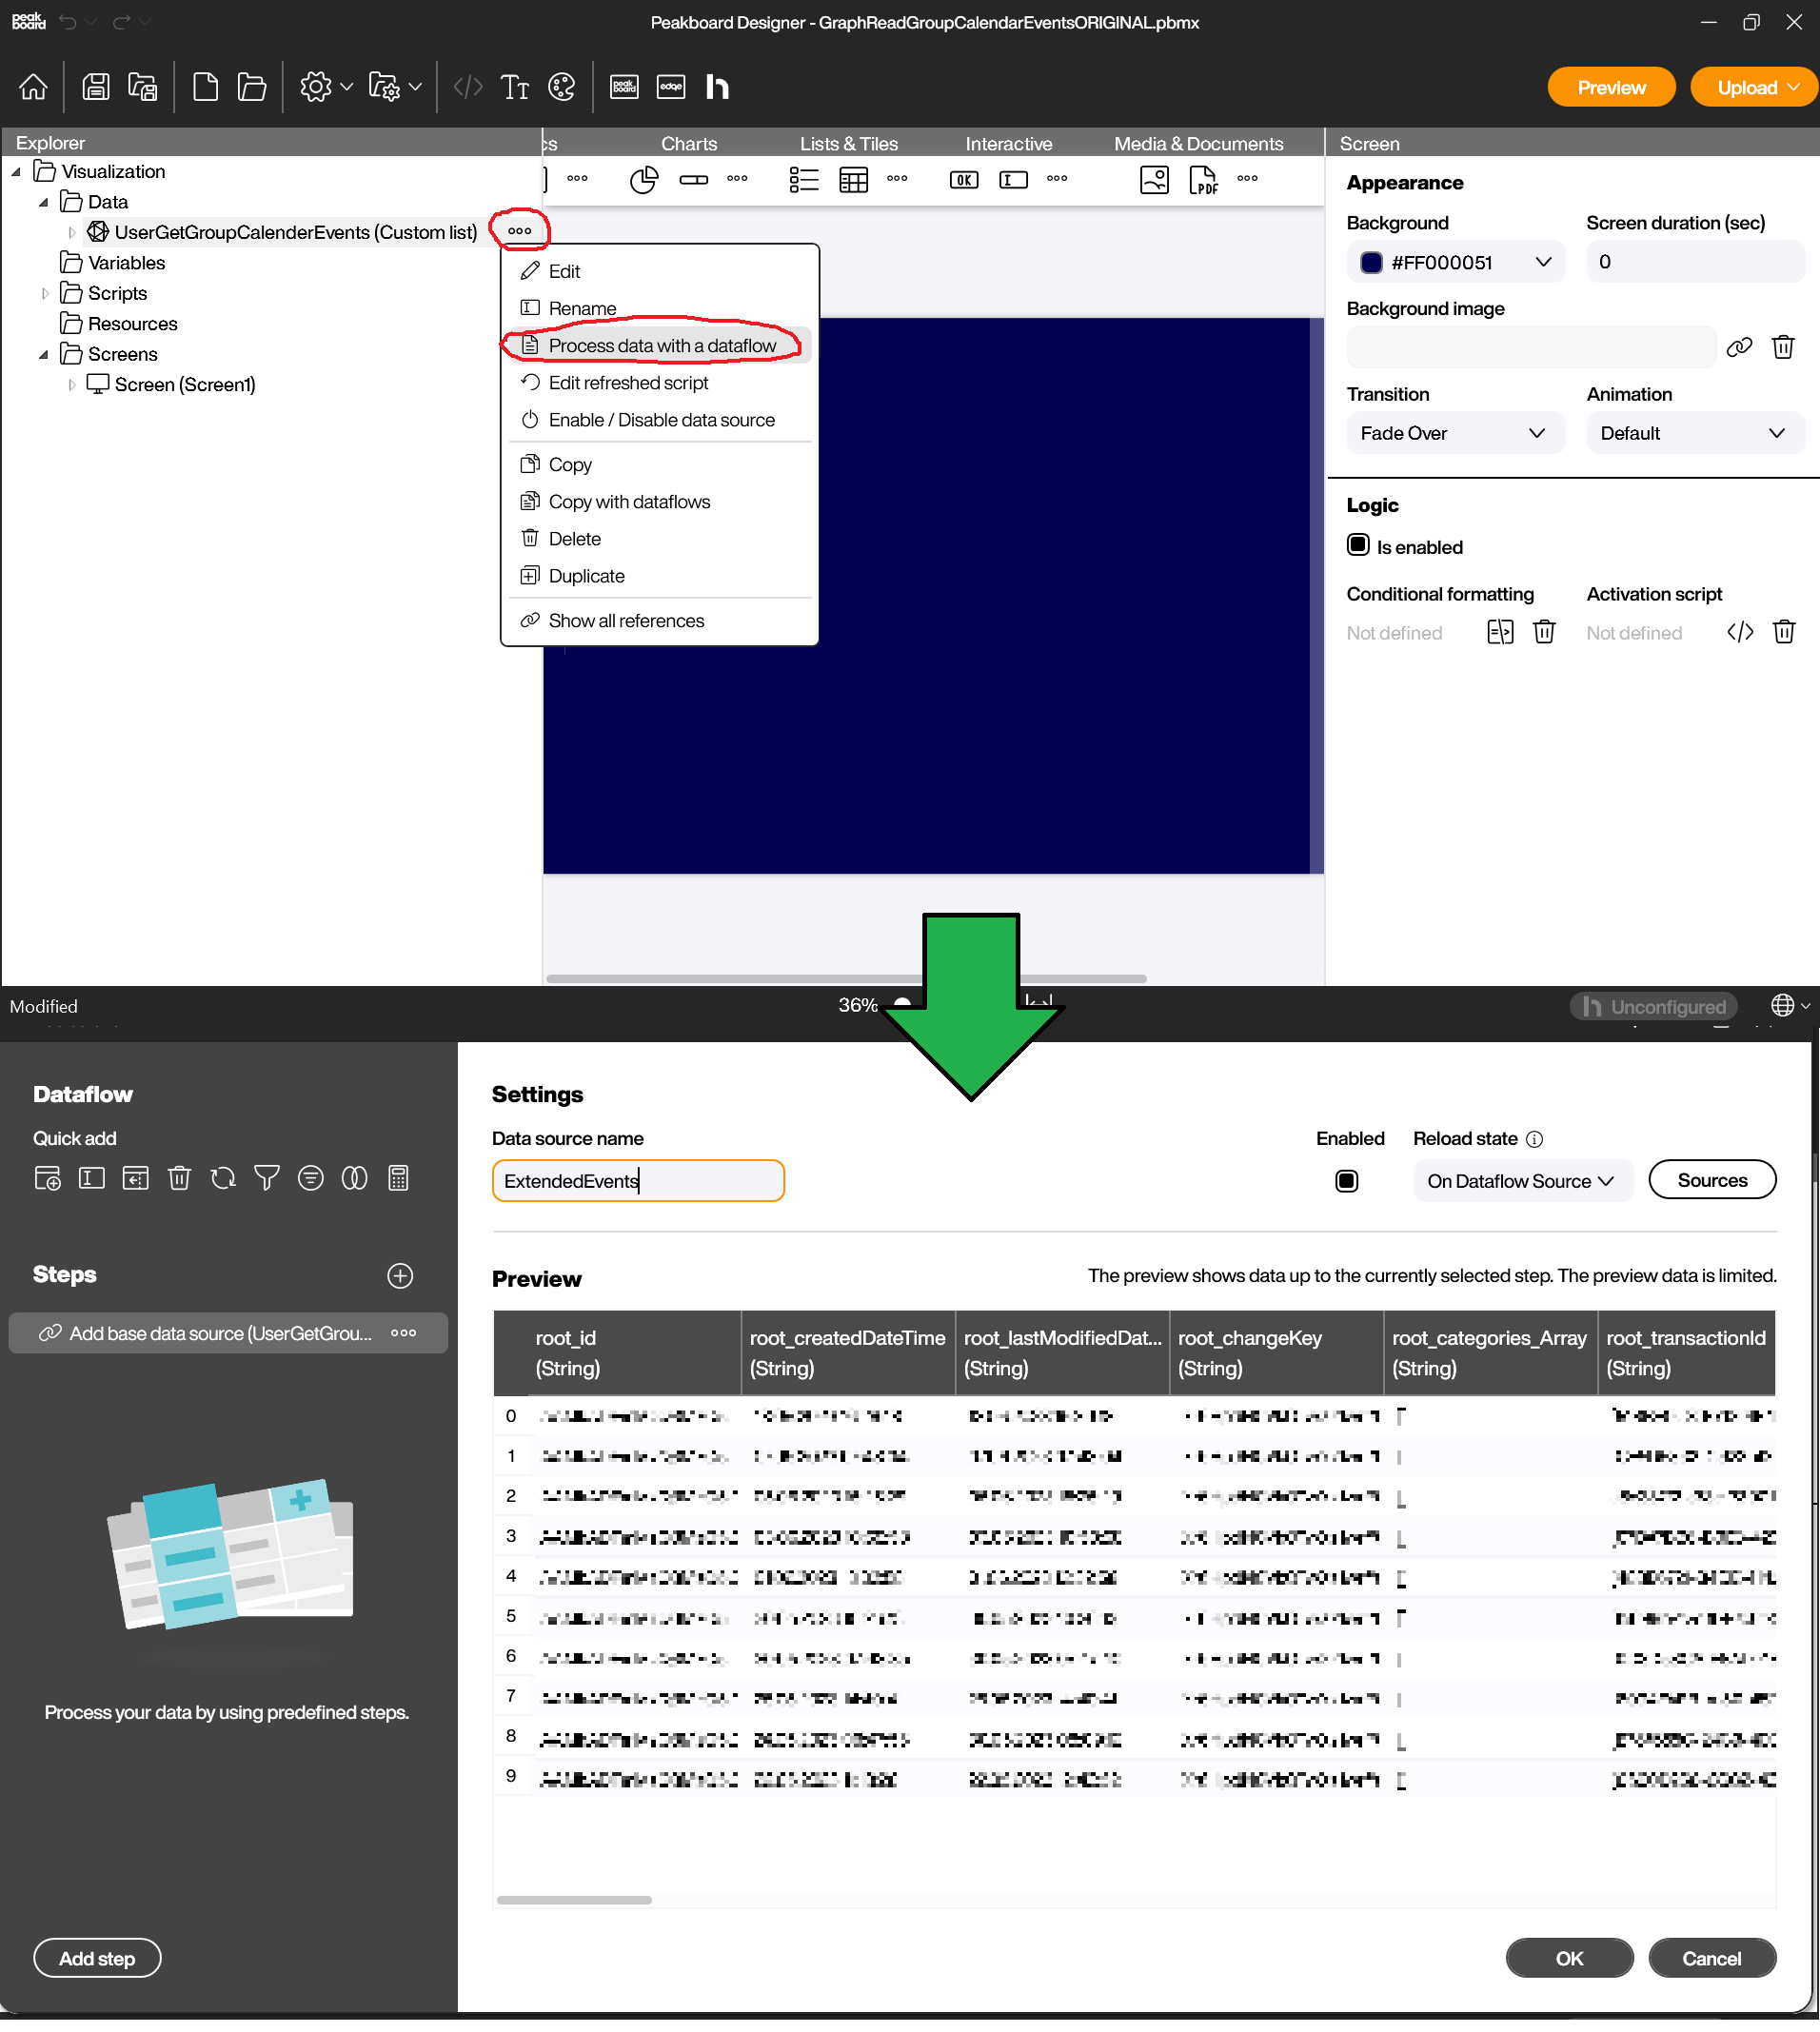
Adding the data flow
Next, we add a data flow to our data source. This data flow will clean, format, and sort the data. That way, the data will appear the way we want it, when we visualize it with a table.
First, we create a new data flow for our data source.
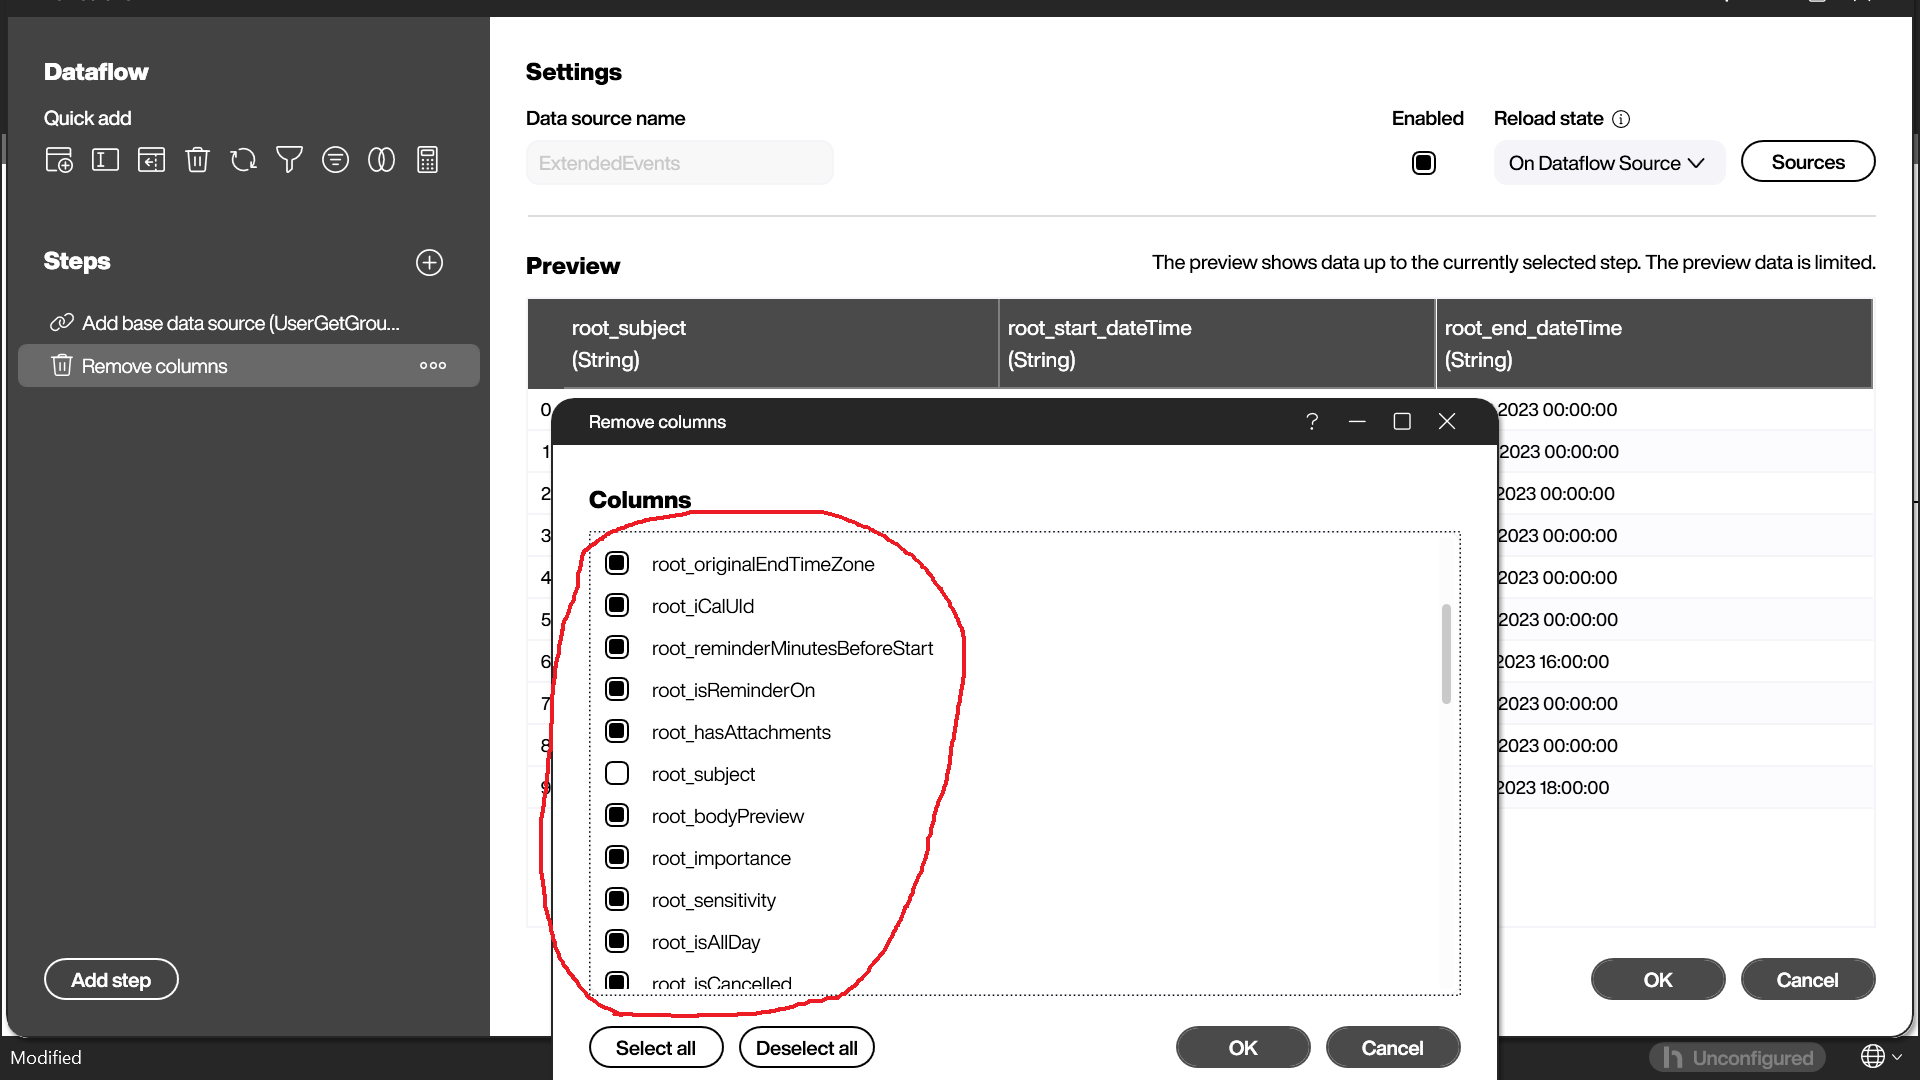
Then, we add a “Remove columns” step to remove all the columns we don’t want. In this case, the only columns we are keeping are the subject, the start time, and the end time.
Next, we add a step that duplicates the root_start_dateTime column. We call this column SortDate.
Later, we will format this column and use it to sort the data chronologically. Why can’t we use the existing start date column for sorting? Because the time portion of the timestamp messes up the automatic sorting.
So, we add an “Add column” step and insert the following line of code:
return item.root_start_dateTime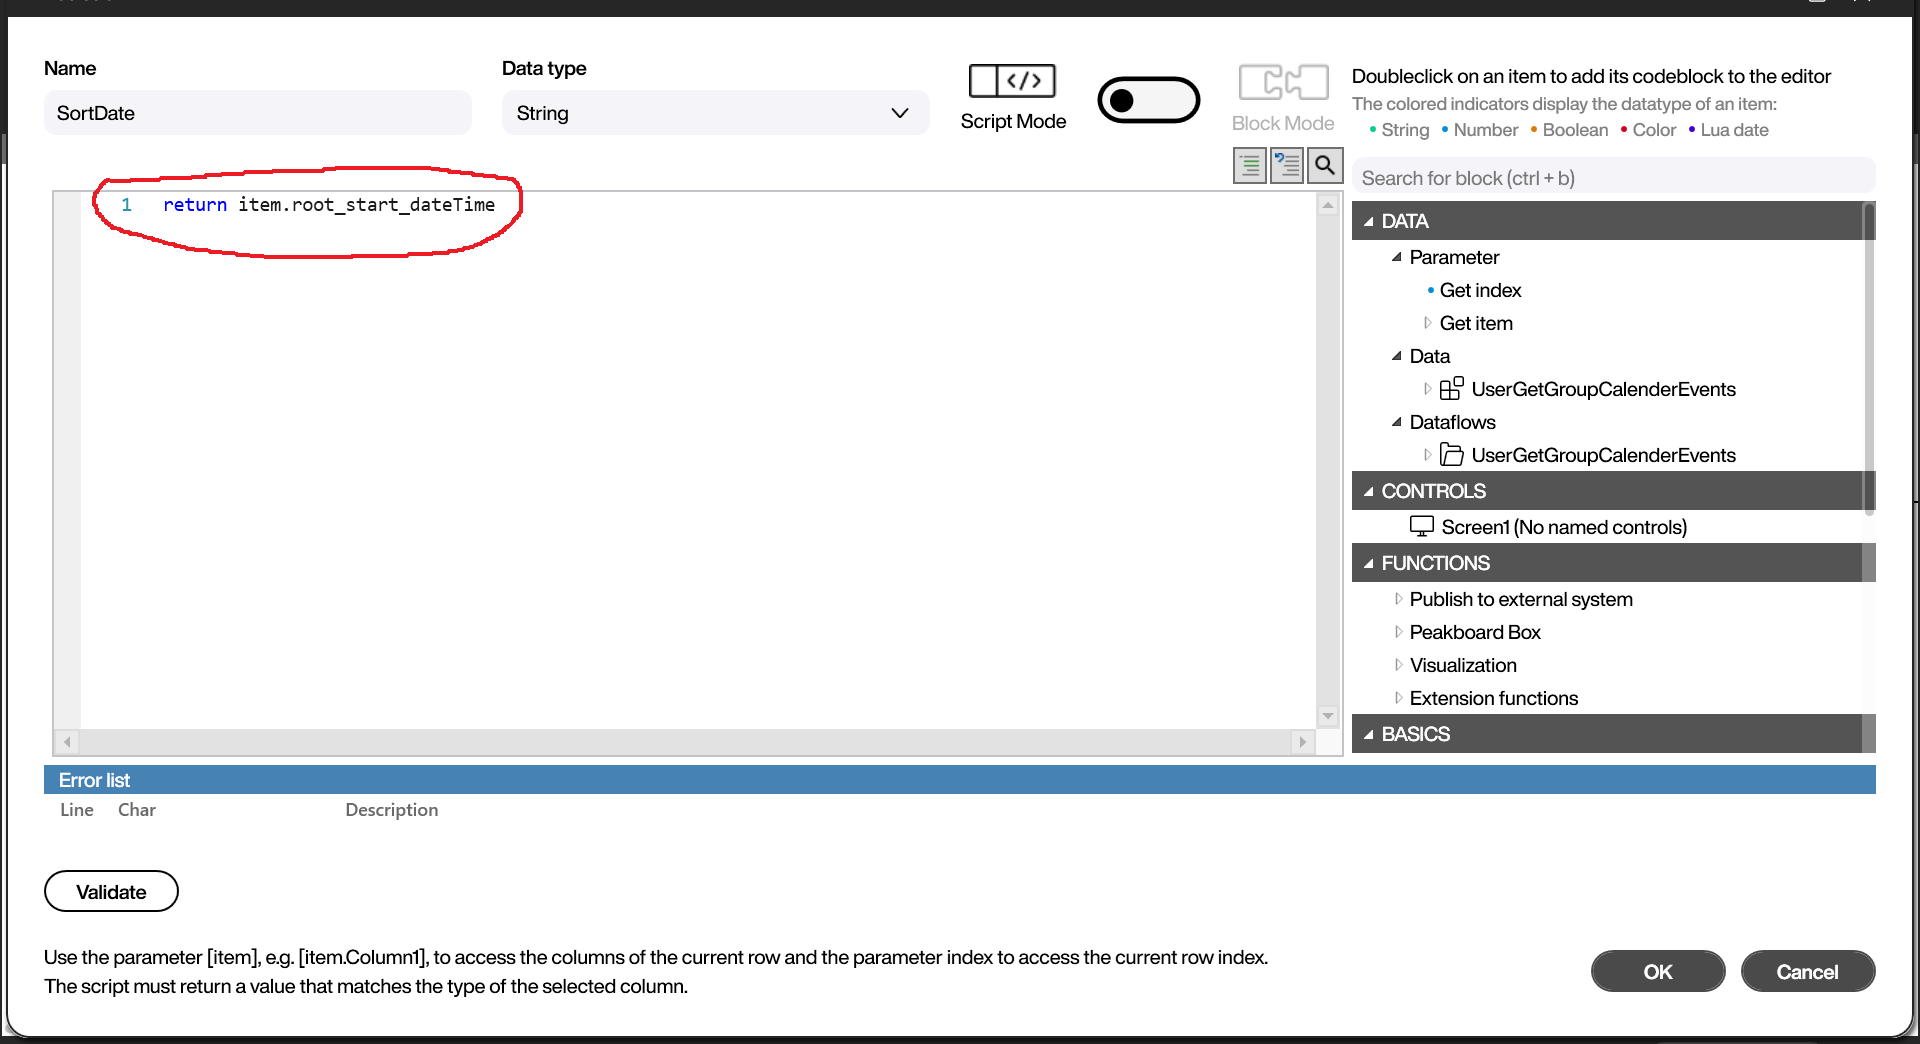
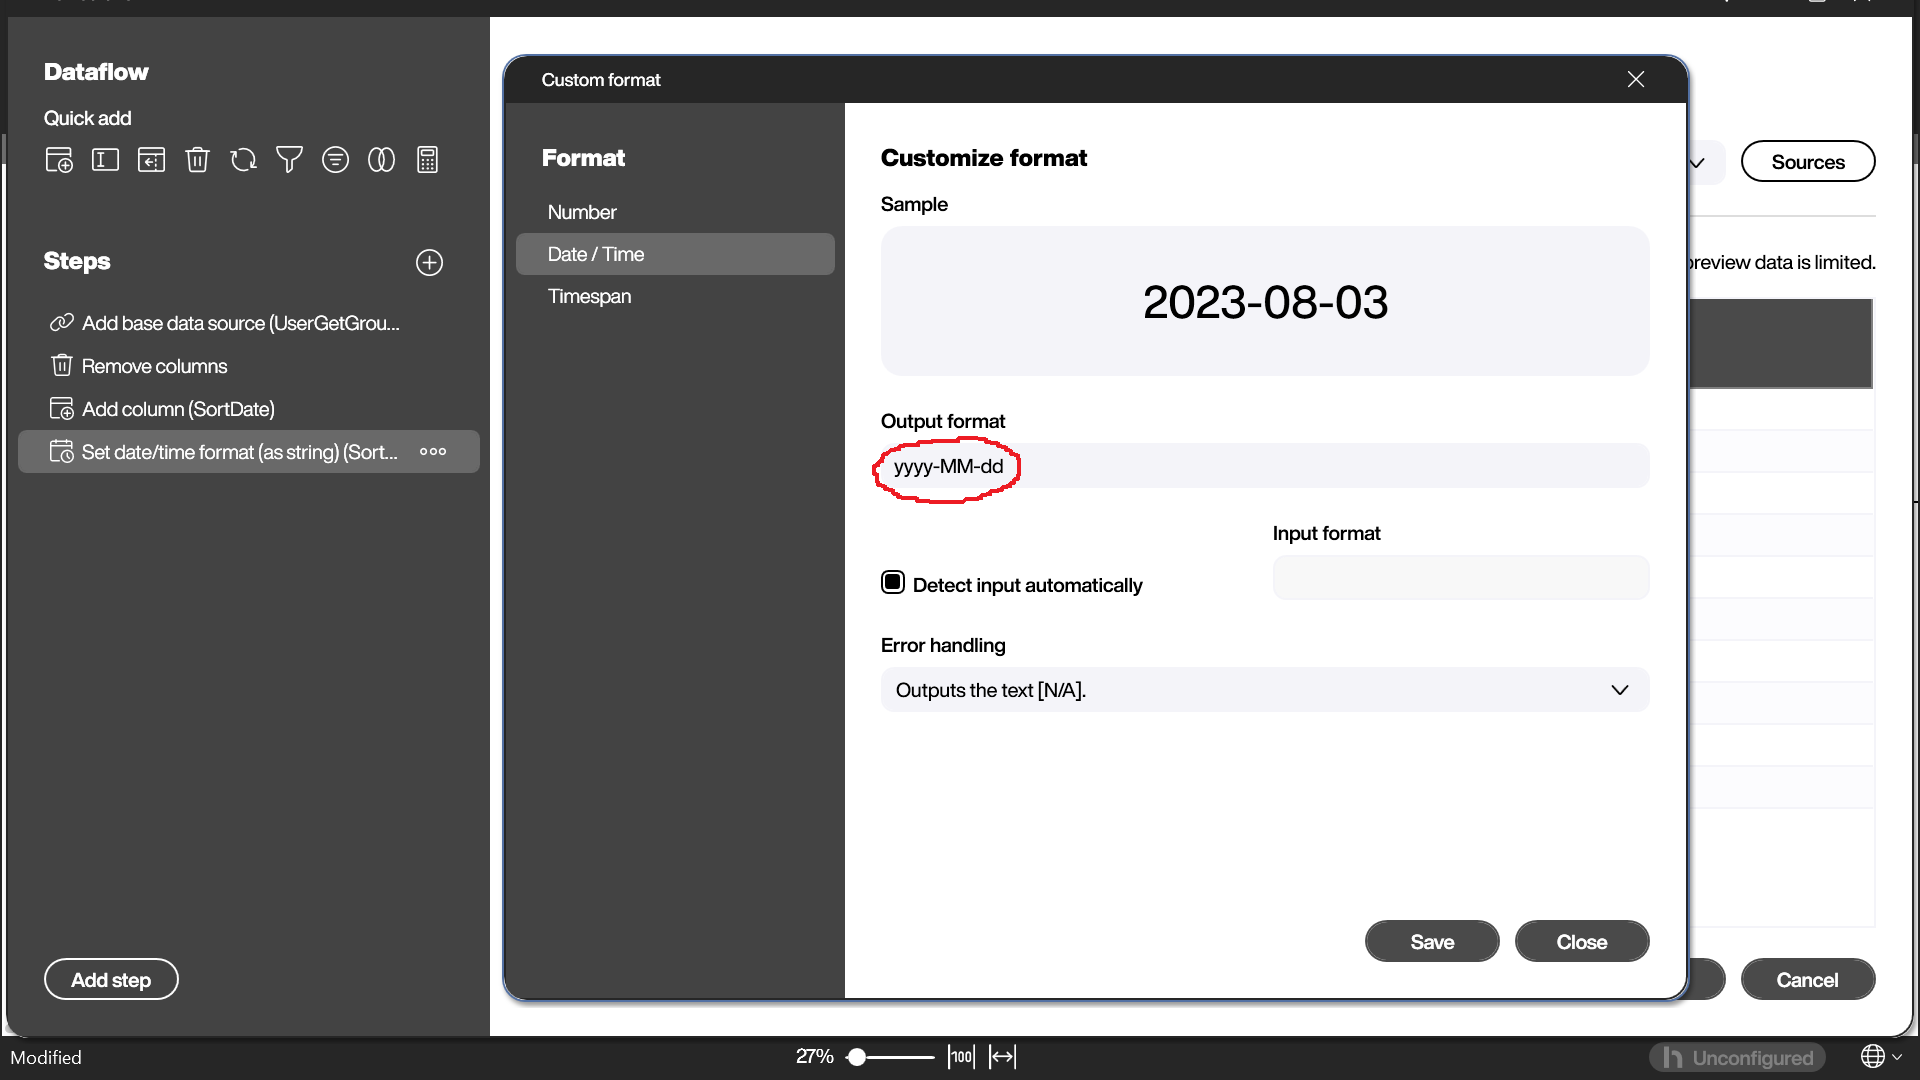
Now, we change the format of the SortDate column into yyyy-MM-dd. This will allow us to use this column to sort the data later.
So, we add a “Set date/time format (as string)” step. We select SortDate as the column we want to change. Then, we click on the three dots, in order to set a custom format.
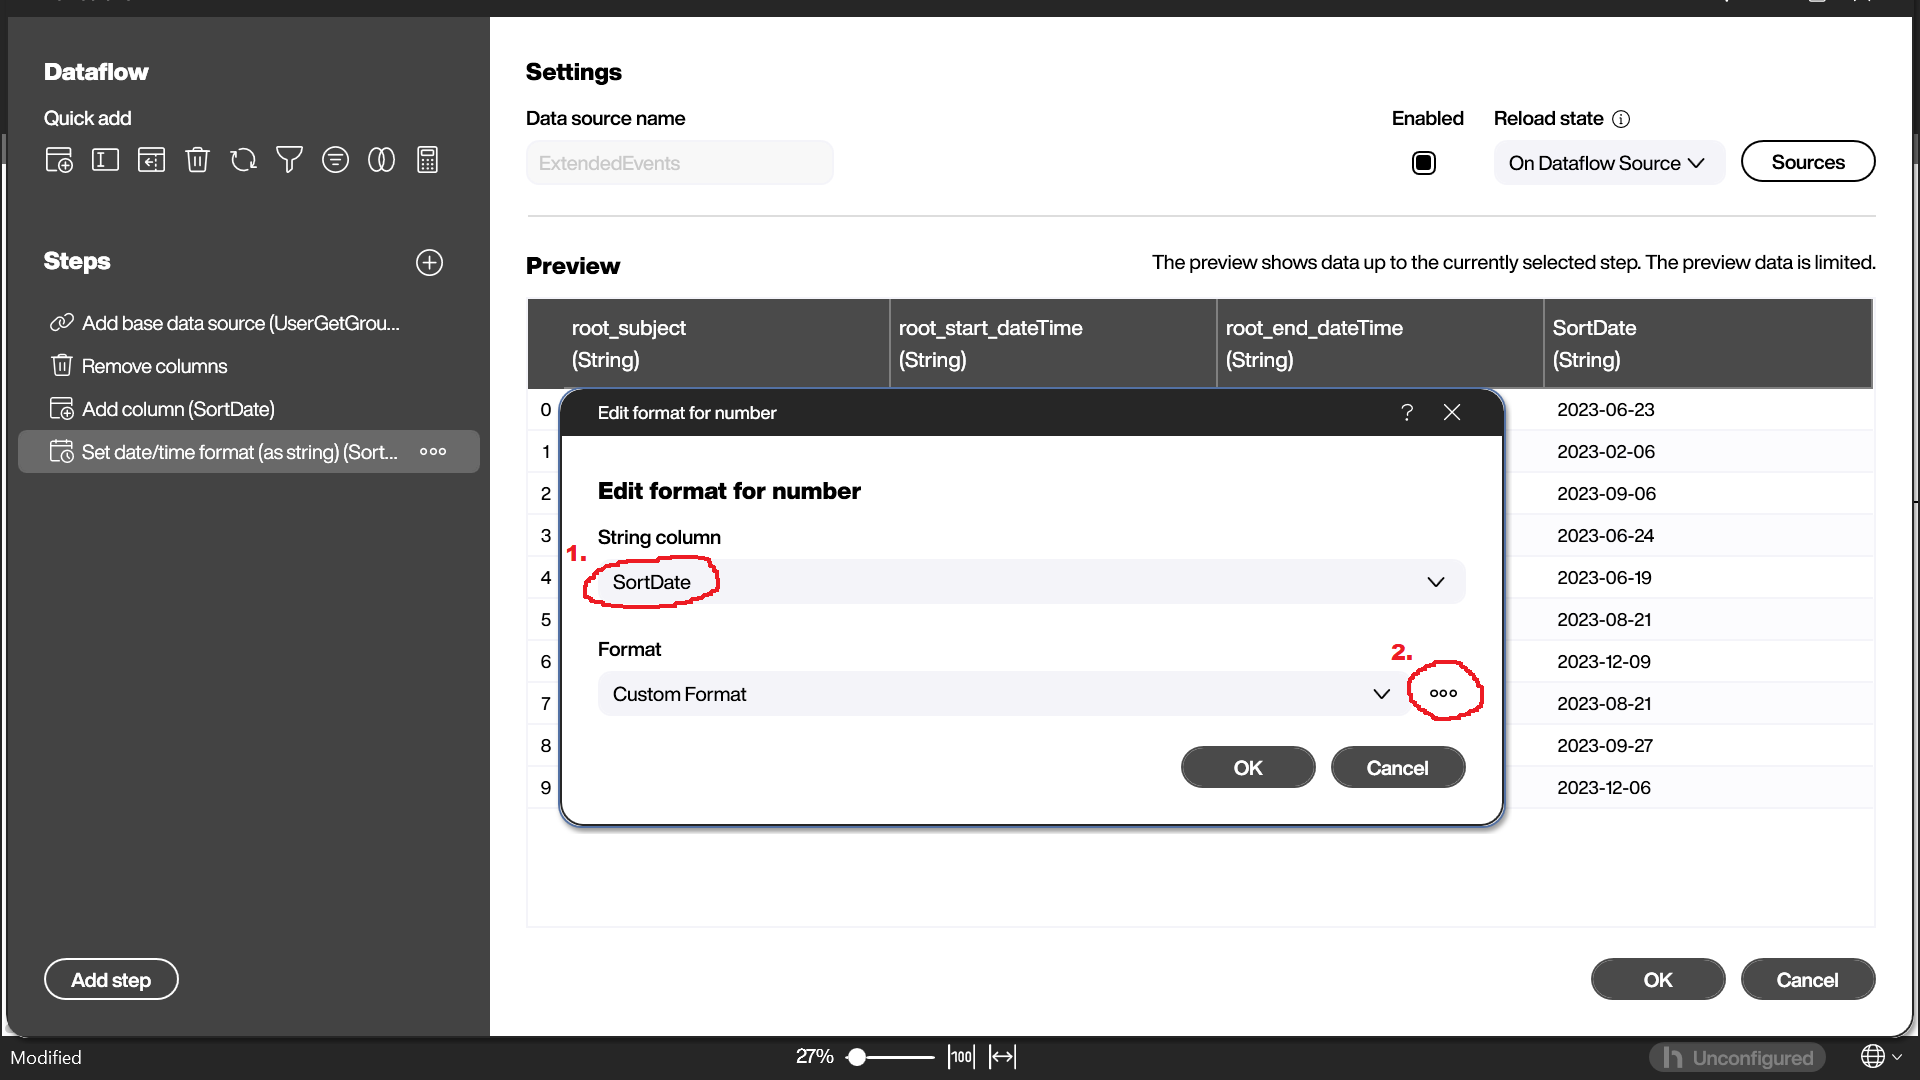
We set the output format to yyyy-MM-dd. The input can be detected automatically, so we don’t need to worry about that.
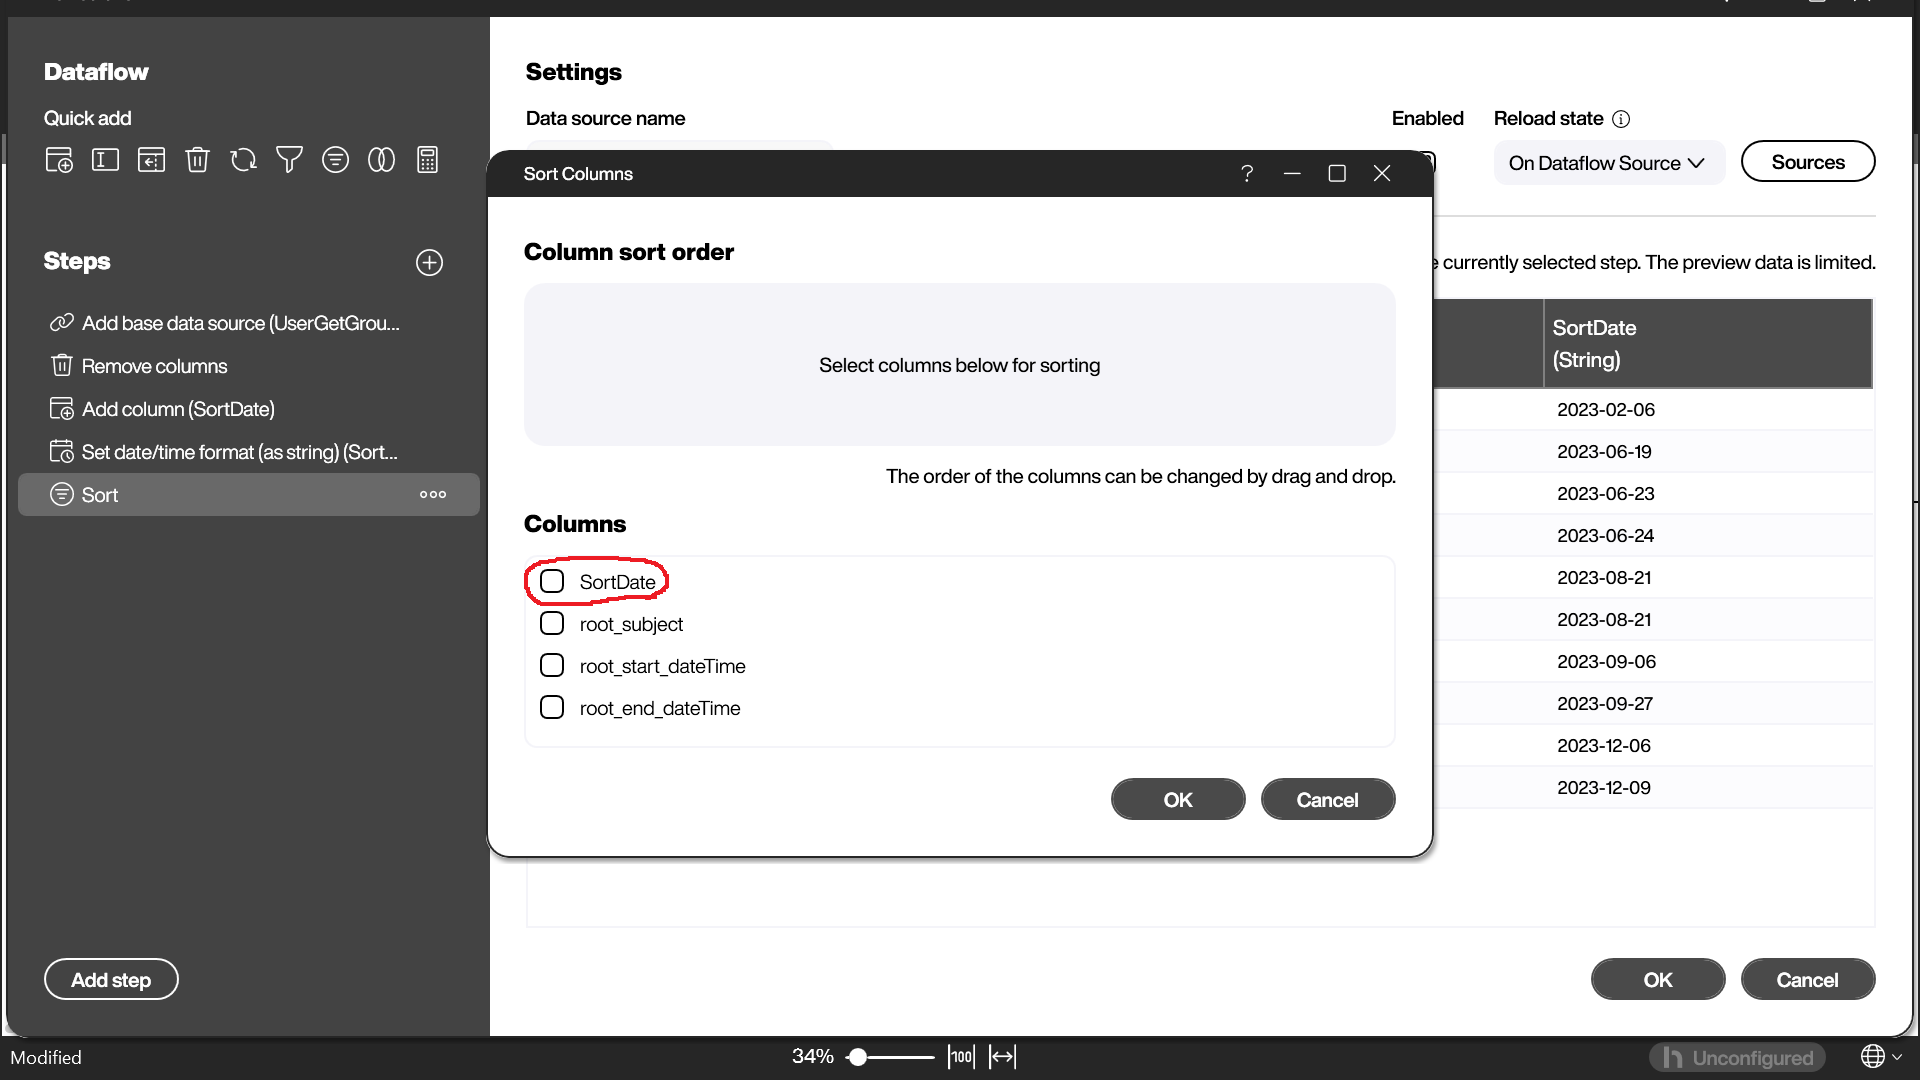
Finally, we add a “Sort” step and select SortDate. This will sort our data in ascending chronological order.
Adding the table
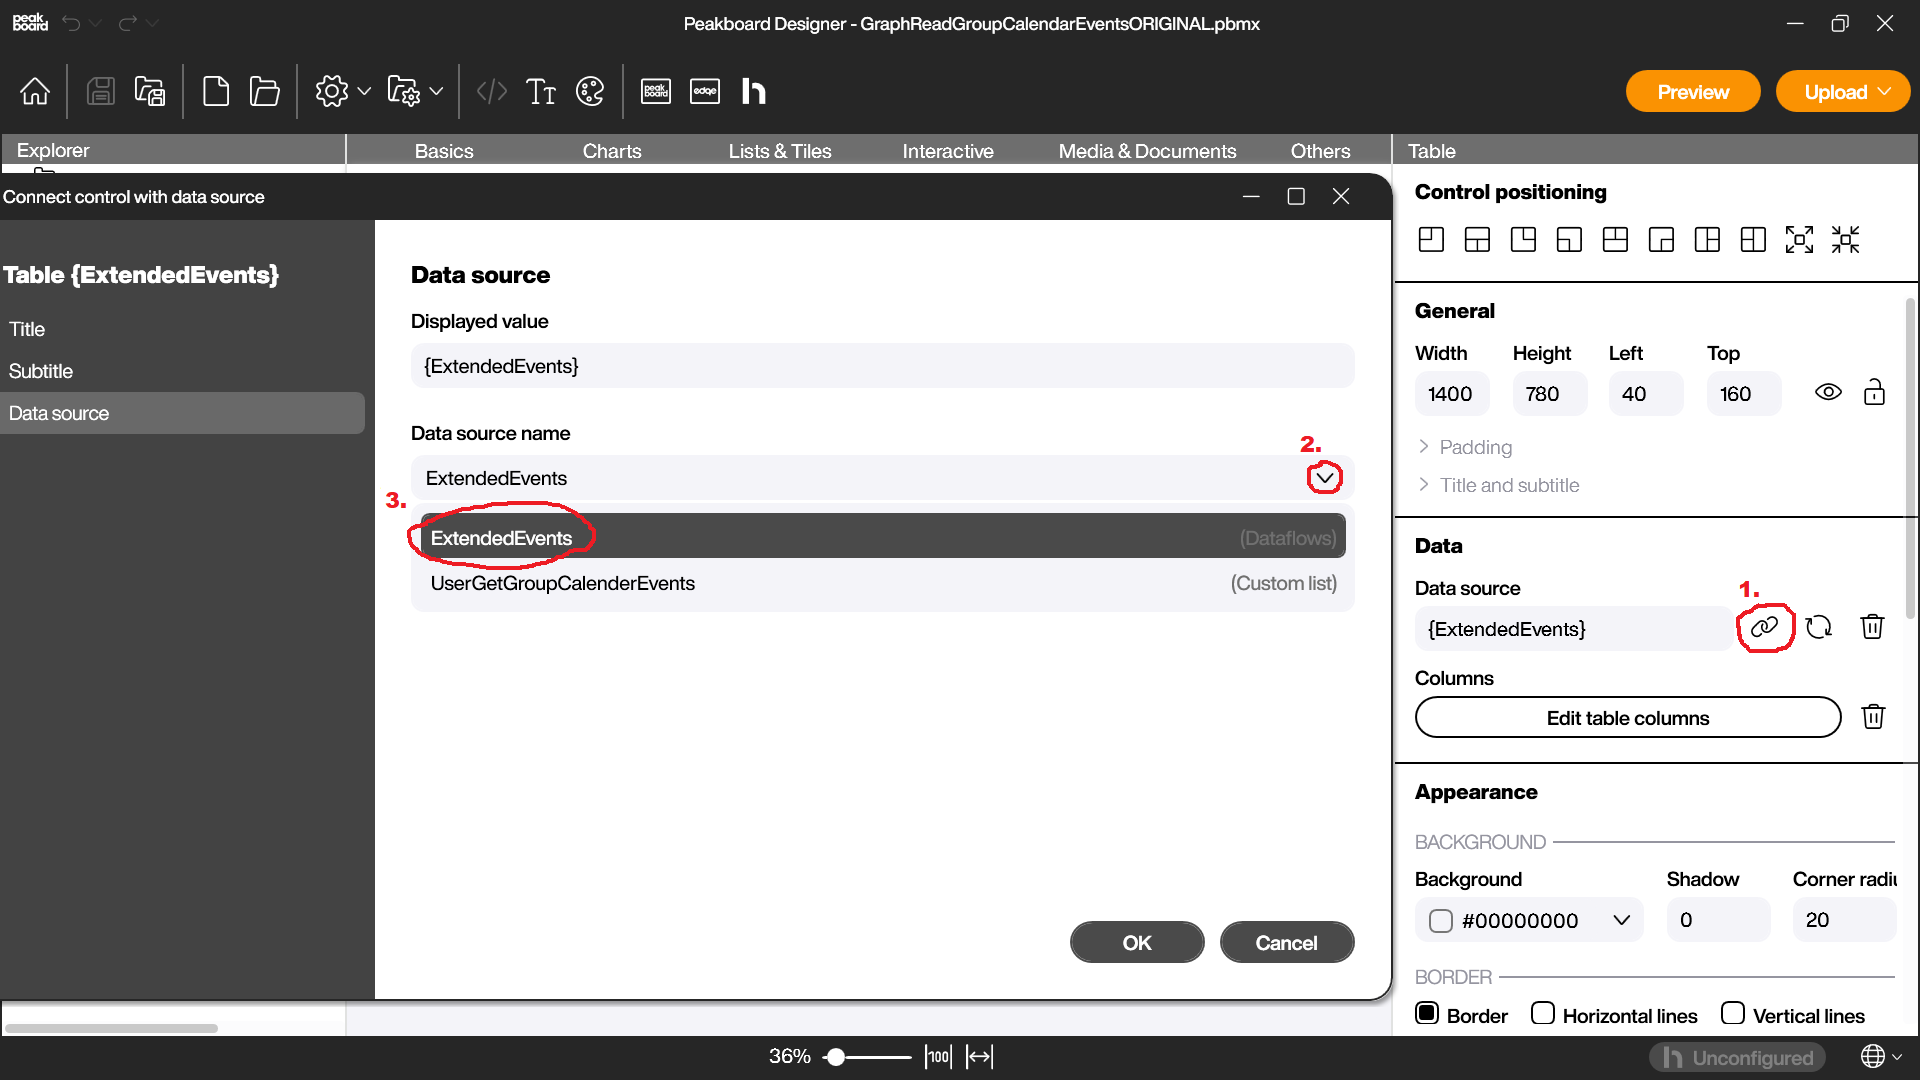
Now, we add a table control to visualize our data.
We add a new table control to our workspace. For the data source, we use our data flow from earlier.
Finally, we add some formatting to the table.
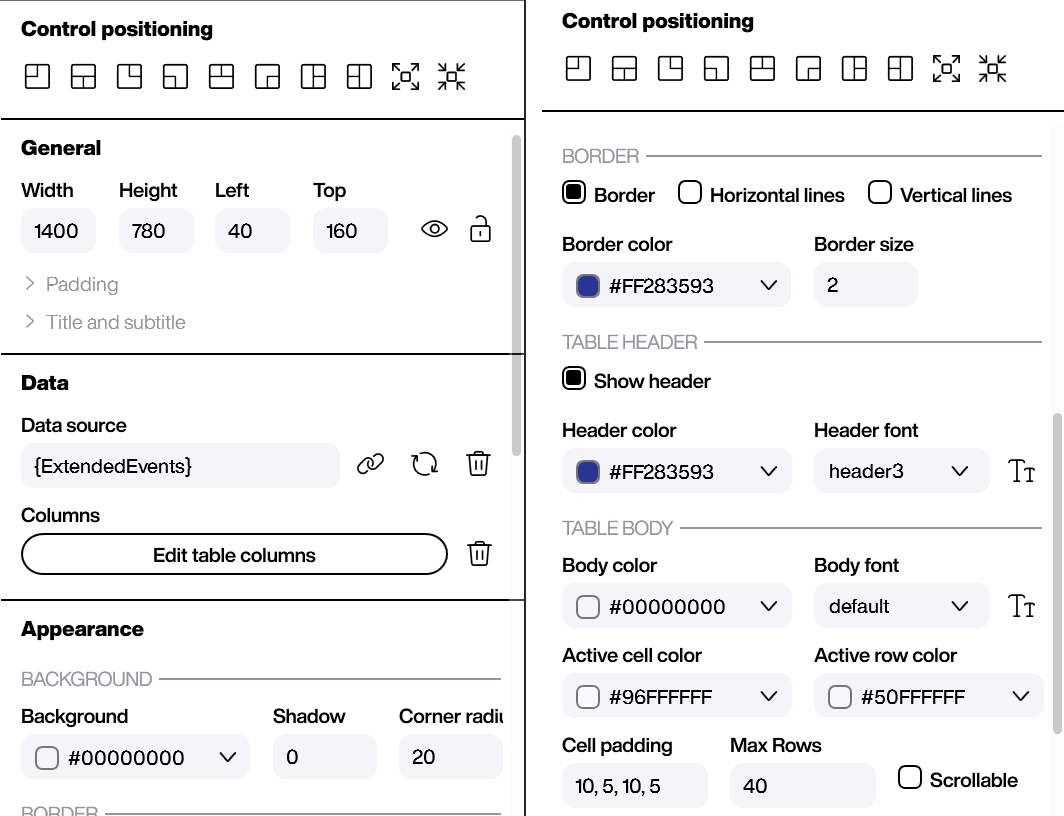
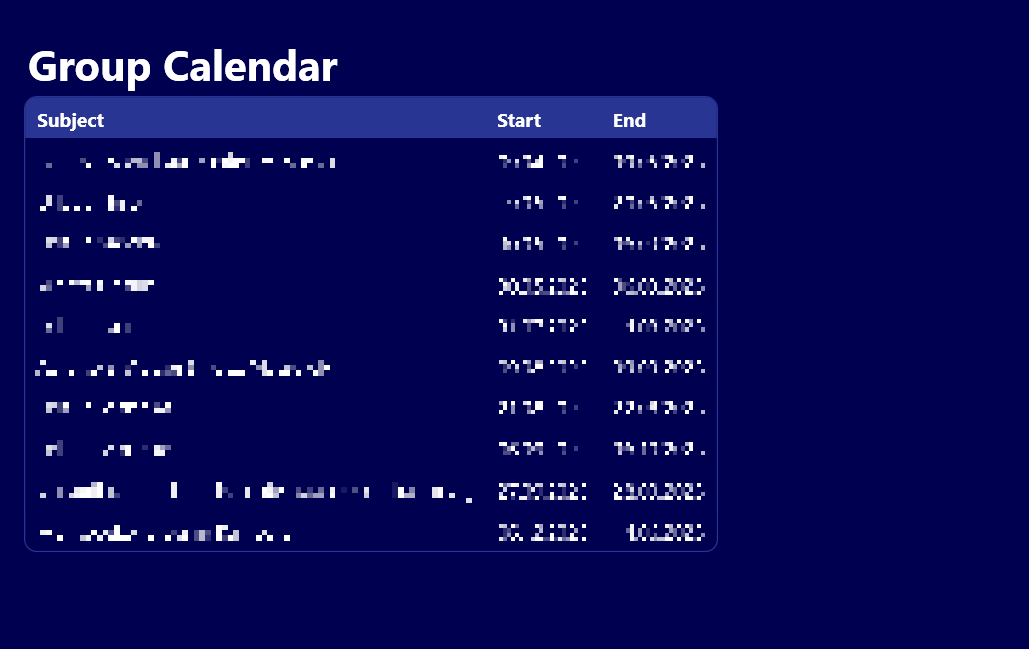
This is what the finished product looks like: