We saw in another article how we can collect, store, and monitor the state of an artefact (machine, person, etc.) with a SQL Server database. But of course, the goal is to give the end user clear and useful information about that state. So, this article explains a very simple, yet best practice pattern, for how to visualize a state without the use of any scripts. We do this with Conditional Formatting (CF).
Please keep in mind what the basic data looks like. We have one row per machine, and we have a column called State, which represents the current state. State is either RUN or STOP.

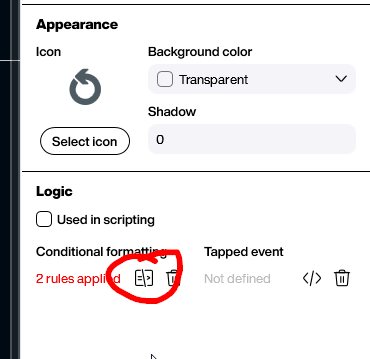
What we want to do now is to visualize these two states by using the icon control. The initial state of this icon control should be a gray circle (no data available), as shown in the screenshot. Please use the search bar, and the color picker, to define the gray circle.

To switch this circle automatically to the actual state of the machine, we apply Conditional Formatting. The CF pane can be accessed by clicking on the CF button in the property grid.

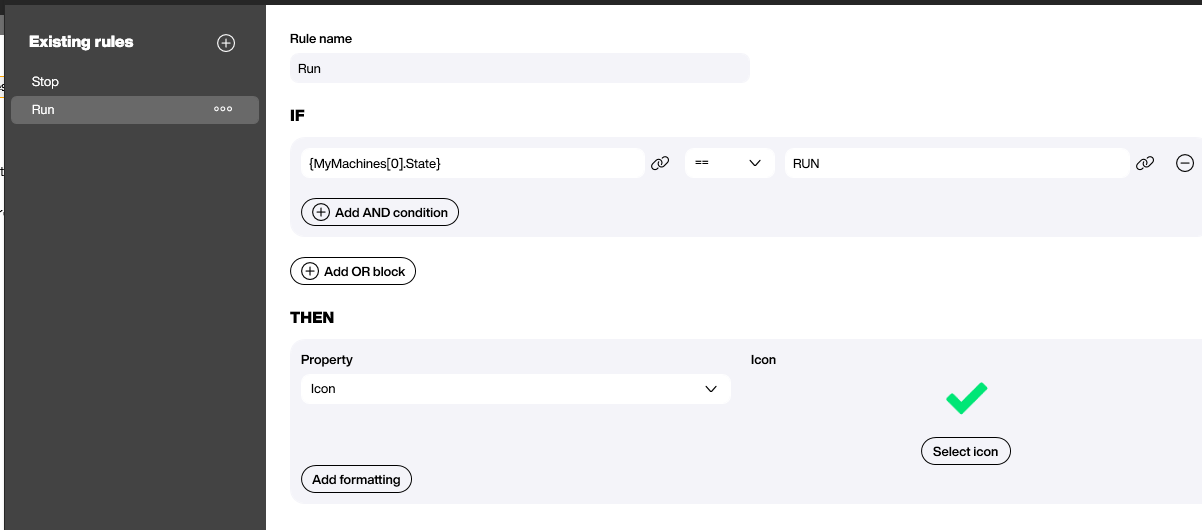
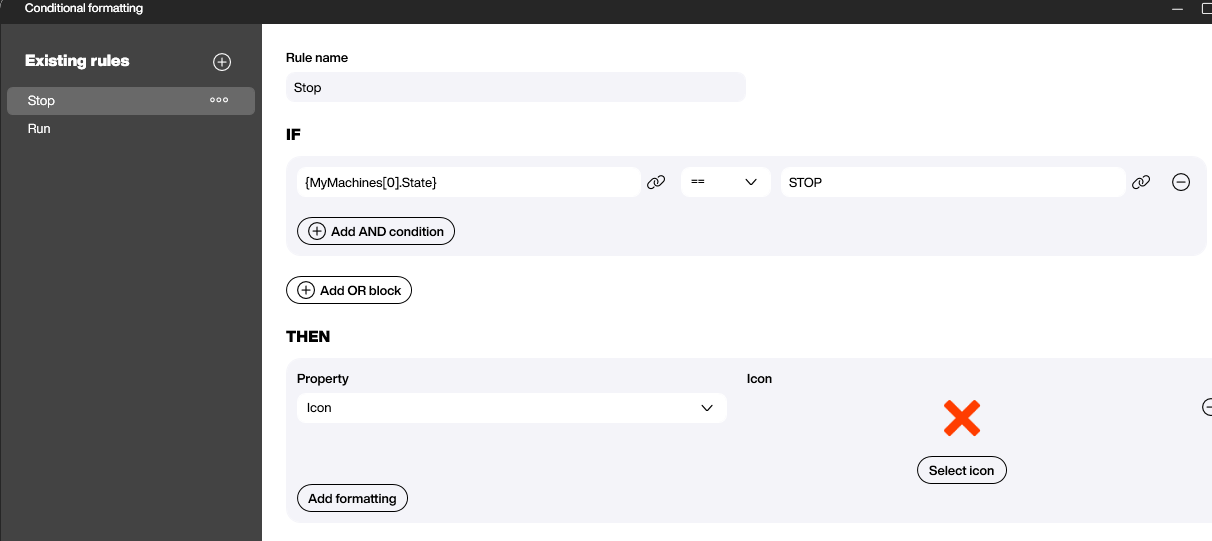
The basic idea behind CF is to apply a set of rules. There can be an unlimited number of rules. Every time the state changes, Peakboard walks through all of the rules (starting from the top), checking the condition, and running the action if the condition is true.
A rule is made up of two parts. First, there’s the condition under which the rule should be run (e.g. “If the column State at row 0 of the MyMachines data source equals RUN”). Then, there is the action that should be run if the condition is true. In our case, the action is to set the Icon property. If the state is RUN, we set Icon to a green check mark. And if the state is STOP, we set Icon to a red cross.


And that’s it….no code, no complicated formula.
Here’s what the icon looks like in the preview board:
