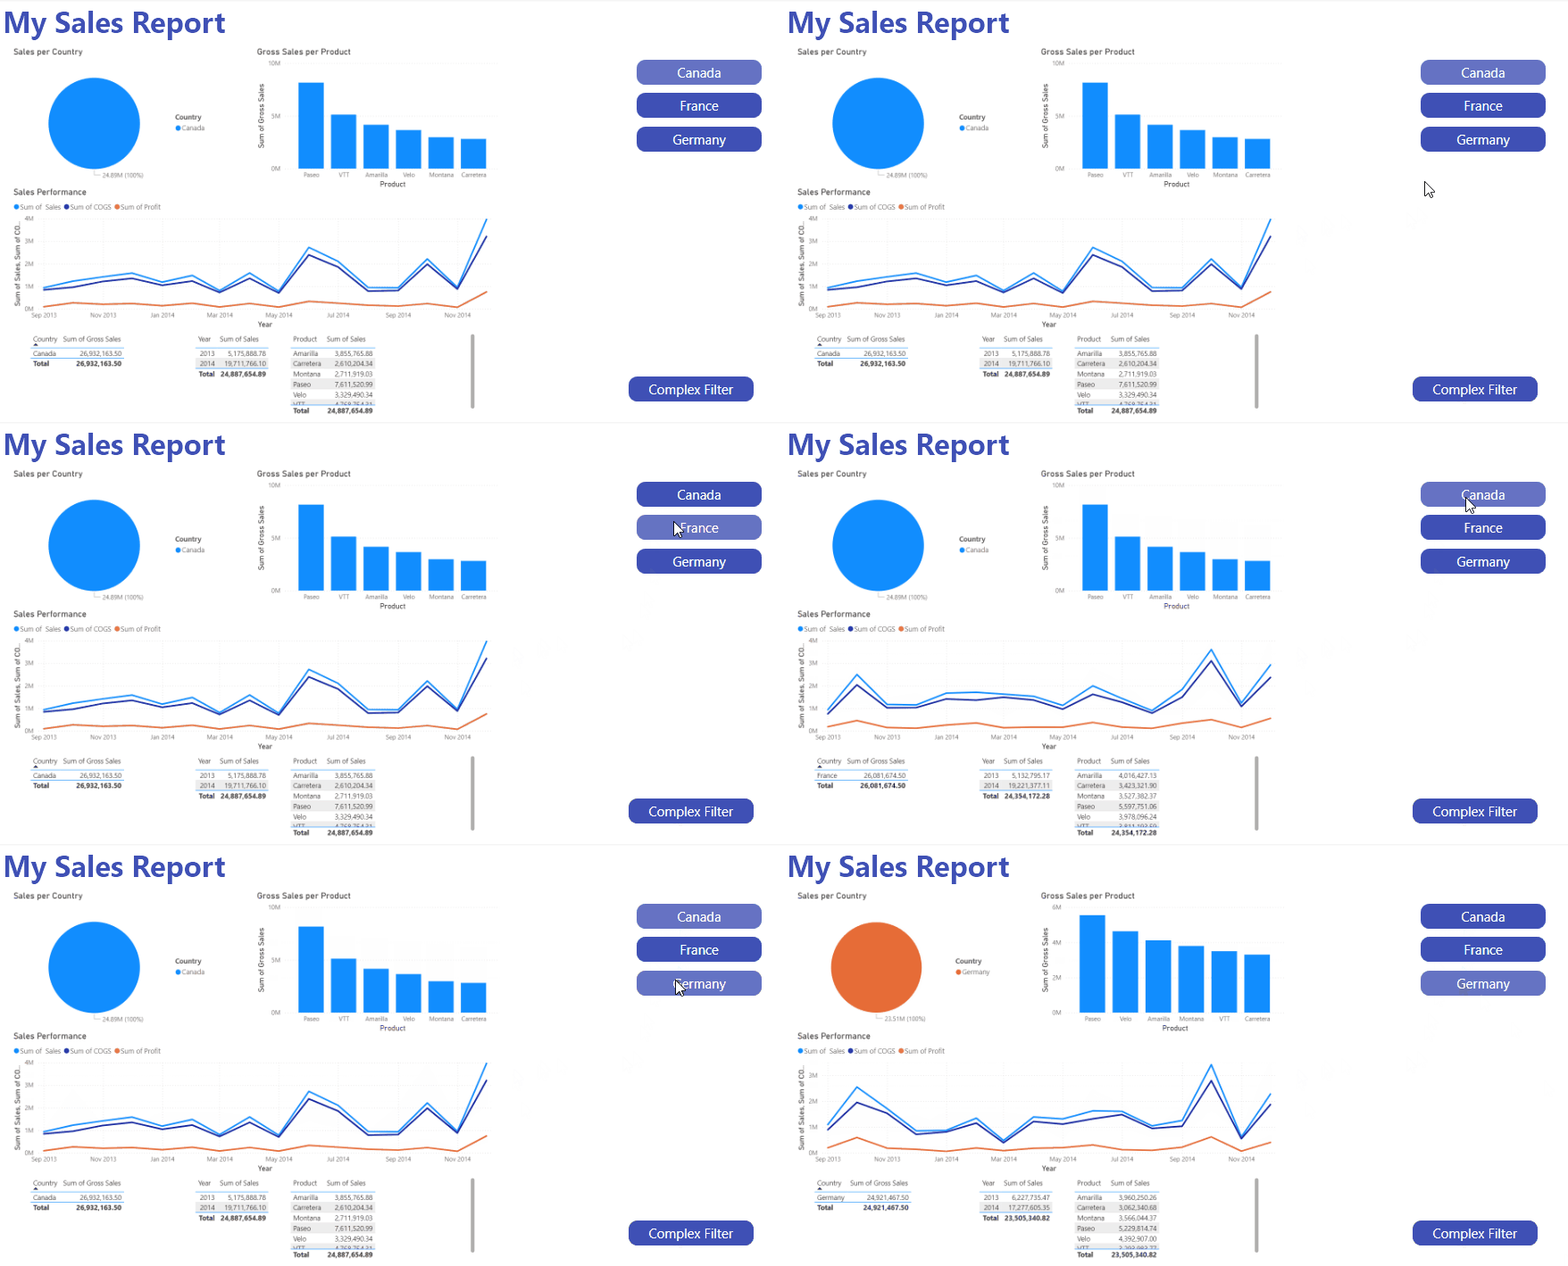
A long time ago, we discussed how to use Power BI maps in Peakboard applications. In this article, we will discuss another aspect of Power BI integration: Filters.
Peakboard users have been able to set dynamic filters since Q3 2024.
Requirements and prerequisites
The Power BI sheet we’re using is just a demo board based on sales transactions, with charts and tables, along with some filters. You can download the Power BI sheet to follow along.
To integrate this PBI report into Peakboard, follow these steps:
- Upload the report to the Microsoft Fabric Portal.
- Follow the steps described in the Power BI help:
- Obtain the application ID, tenant ID, and user credentials.
- Use the IDs and credentials to access the hosted Power BI report from within Peakboard Designer.
- Choose the workspace and report.

Under the Report settings tab, we can apply filters to the report. The filters are built as JSON strings.

Filters
The filters are actually an array of filters wrapped in brackets. Here is the basic form of JSON that can be used in the filter property of the PBI control:
[
      Filter 1 ...
    ,
      Filter 2 ...
]
There are two types of filters:
- Basic filter, which selects distinct values.
- Complex filter, which has multiple conditions.
The following is an example of a basic filter with two distinct values, “Canada” and “India.” The target describes the table and column within the data PBI model.
{
    "target": {
        "table": "financials",
        "column": "Country"
    },
    "operator": "In",
    "values": ["Canada", "India"]
}
The complex filters are a bit more complicated, because we can provide multiple conditions connected with a logical operator:
{
    "target": {
        "table": "financials",
        "column": "Units Sold"
    },
    "logicalOperator": "And",
    "conditions": [
        {
            "operator": "GreaterThan",
            "value": "150"
        },
        {
            "operator": "LessThan",
            "value": "201"
        }
    ]
}
Here’s one last example that shows how to use date fields in a complex filter:
{
  "target": {
    "table": "Time",
    "column": "Date"
  },
  "logicalOperator": "And",
  "conditions": [
    {
      "operator": "GreaterThan",
      "value": "2014-06-01T07:00:00.000Z"
    }
  ]
}
The way basic and complex filters are created and combined with each other is similar to how a human PBI dashboard user would apply filters. If we keep that in mind, it’s easy to find the right JSON to apply to our own PBI report.
Make filters dynamic
In most cases, we need a dynamic filter rather than a fixed JSON string. In the Peakboard Power BI control filter property, you can use dynamic placeholders. You can download the attached PBMX to learn more about the following examples.
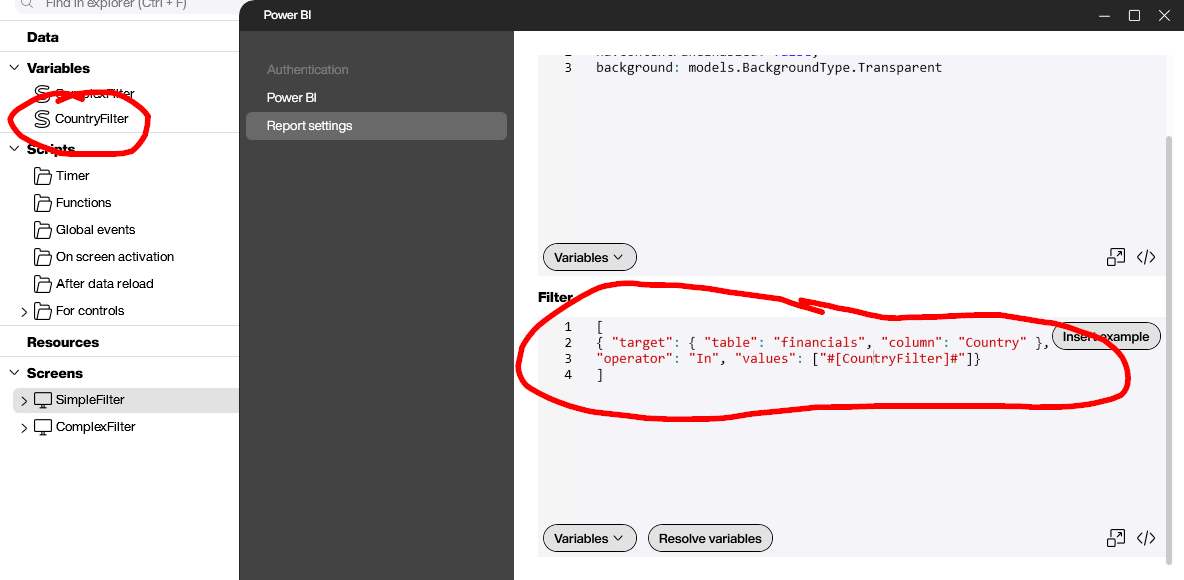
In the first example, we make the country dynamic:
[
{ "target": { "table": "financials", "column": "Country" },
"operator": "In", "values": ["#[CountryFilter]#"]}
]
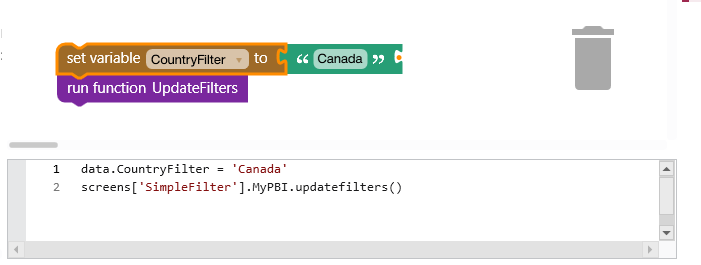
To set and activate the filter during runtime, we set the content of the variable and then call UpdateFilters to refresh the control:
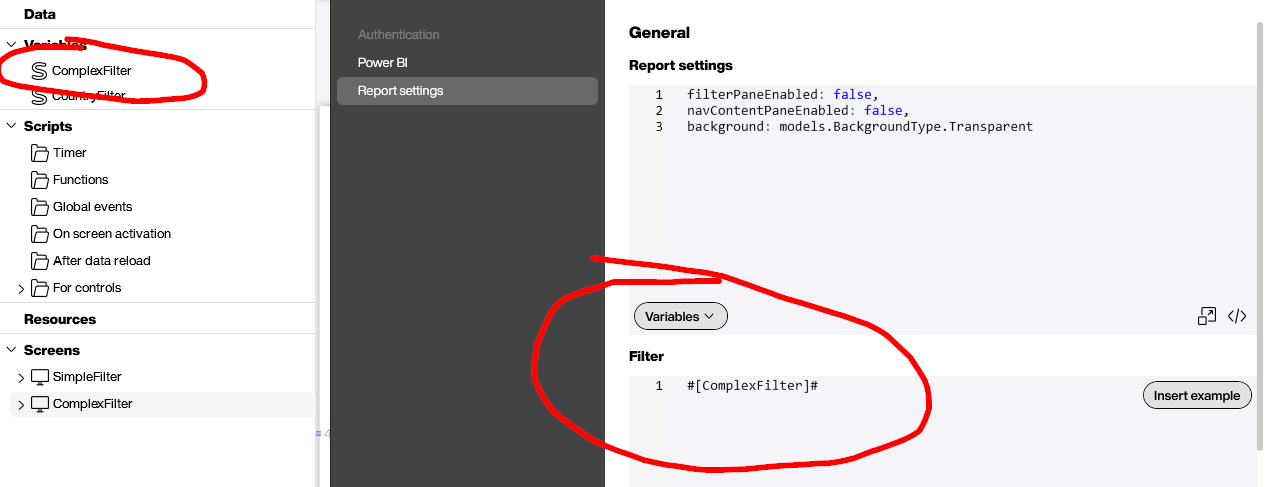
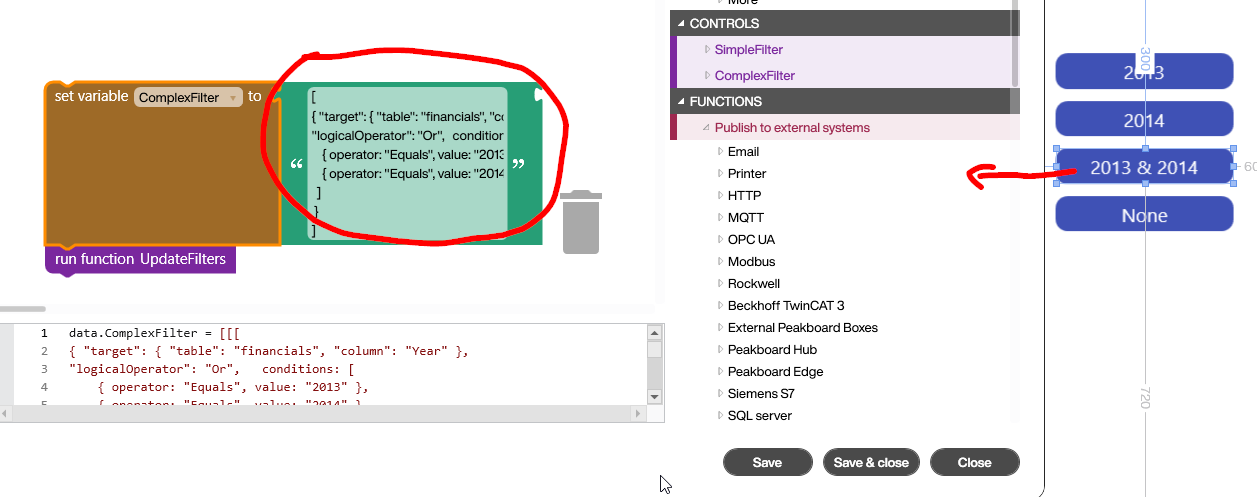
If things get more sophisticated than just exchanging single values, we can make the whole JSON string dynamic:
And then we build the whole JSON string with Building Blocks or LUA:
Conclusion
Setting dynamic filters through JSON strings is a perfect way to fully integrate Power BI dashboards into Peakboard applications dynamically. Building the right dynamic JSON string may be a challenge, especially because the Power BI filter engine won’t give you any hints if the JSON is incorrect or not understood by the engine.
