A lot of people use Peakboard as a medium to integrate Power BI dashboards with other data, and create a dashboard that mashes up both non-Power-BI with Power-BI visuals and data. In today’s article, we will see how to do just that. We will build a Power BI report with certain elements, including a map which we will put onto a Peakboard canvas.
Building the Power BI report
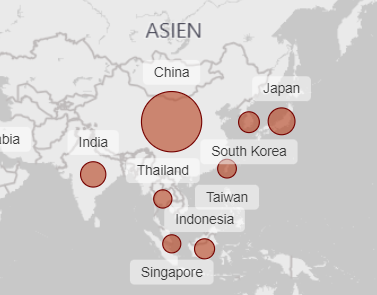
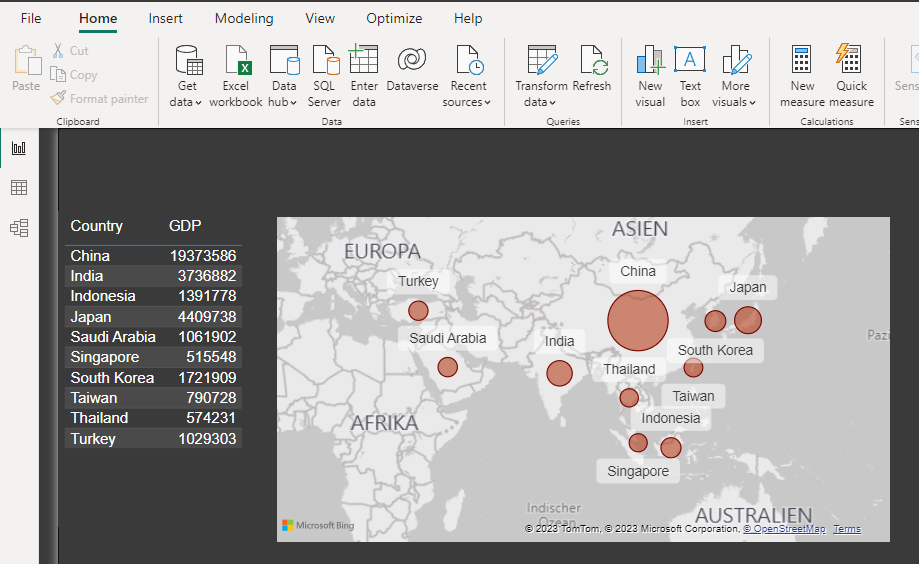
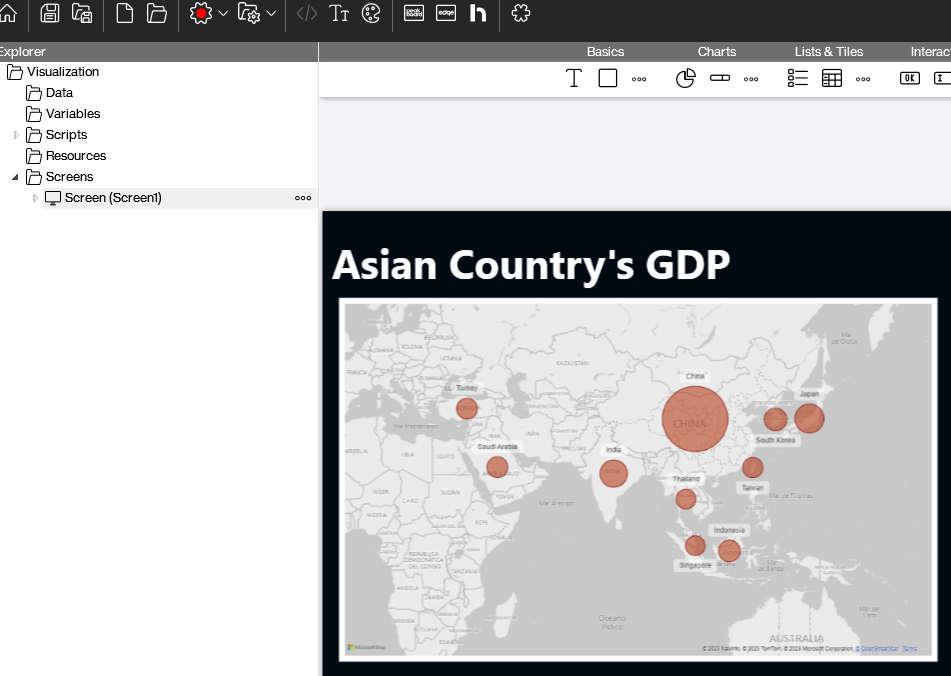
Our sample report contains a table of Asia’s 10 largest economies, along with their GPD. Beside the table is a map representing the data. Each bubble represents one country. Feel free to download the PBIX here.
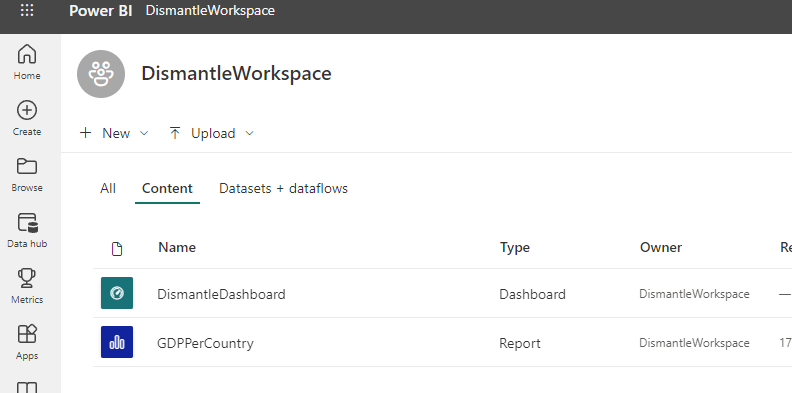
Go ahead and upload this report to a Power BI workspace. Along with that, create a new, empty dashboard there.
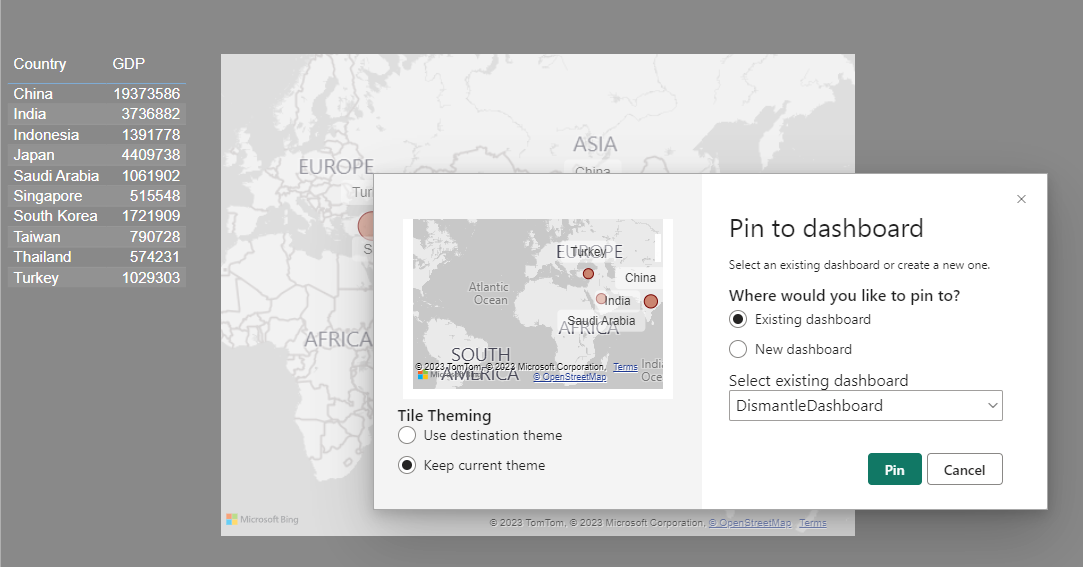
Open the report from the workspace overview and click on the pin in the top-right corner of the map visual. Then, pin it to the dashboard. That’s it! We only need the visual to be pinned somewhere on a dashboard in order to pick it out later in Peakboard. In this case, it’s called a Tile in the language of Power BI.
Requirements for embedding Power BI artifacts
In order to embed Power BI reports and tiles in external apps, you first need a registered App in your Azure AD. To learn how to do this, please check the Peakboard documentation. Each step is explained there, especially how to get the client ID and the tenant ID which we will need later.
Besides this, you will need to provide user credentials for a user that has access to the workspace we created earlier. You need a real user beside the app registration. It’s doesn’t make much sense, but that’s just how Microsoft designed it, so please complain to them. Another unfortunate thing is that this process doesn’t support 2FA. So in case you have a 2FA policy in place, please deactivate it for this specific user and restrict their permissions as much as possible, to maintain an acceptable level of security.
Building the board
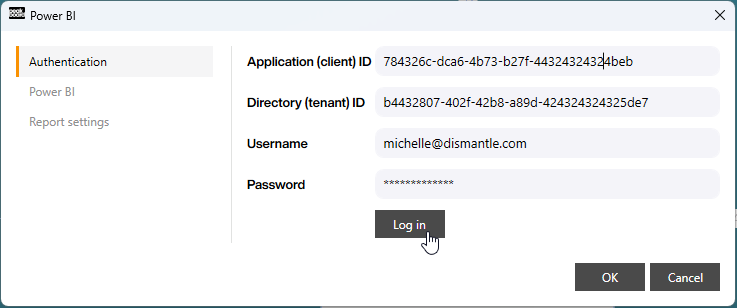
Let’s begin on the Peakboard side by dragging a new Power BI control onto the canvas. The control asks you for the IDs you collected during the setup process of the app registration. It also asks you for a user with enough permissions to access the workspace. After entering all the information, log in.
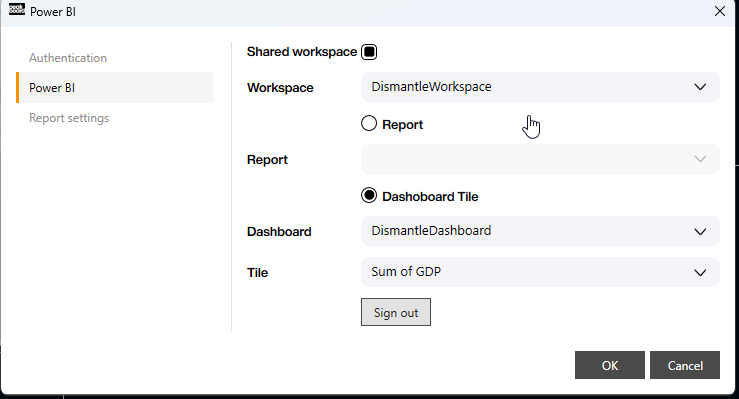
On the next pane, you can select the name of the shared workspace. If the user who created the workspace is the same as the user here, it might be a private workspace instead of a shared workspace.
Peakboard lets you embed two types of objects: reports or dashboard tiles. In the real world, most people prefer to embed a single dashboard’s tile rather than a whole report, because it’s cleaner and simpler. But the decision depends on the use case. We’re sticking to our sample dashboard, as shown in the screenshot.
And now we’re all set to enjoy our dashboard tile as part of the Peakboard canvas.
Troubleshooting and tips
- Be very careful with the API permissions during app registration. The permissions are listed in the help file, but they may vary for some use cases. It may be necessary to add additional permissions.
- Be very careful with the username and password, especially when switching off 2FA. Restrict the user’s permissions as much as possible.
- In most cases, dashboard tiles are better than a whole report. When in doubt, use the tiles.