OpenWeatherMap offers a simple, easy-to-use API that provides weather data for anywhere on Earth. This API runs in the backend of many websites and applications. And here’s the best part: Some of the API endpoints are free to use, so long as you don’t exceed a certain quota.
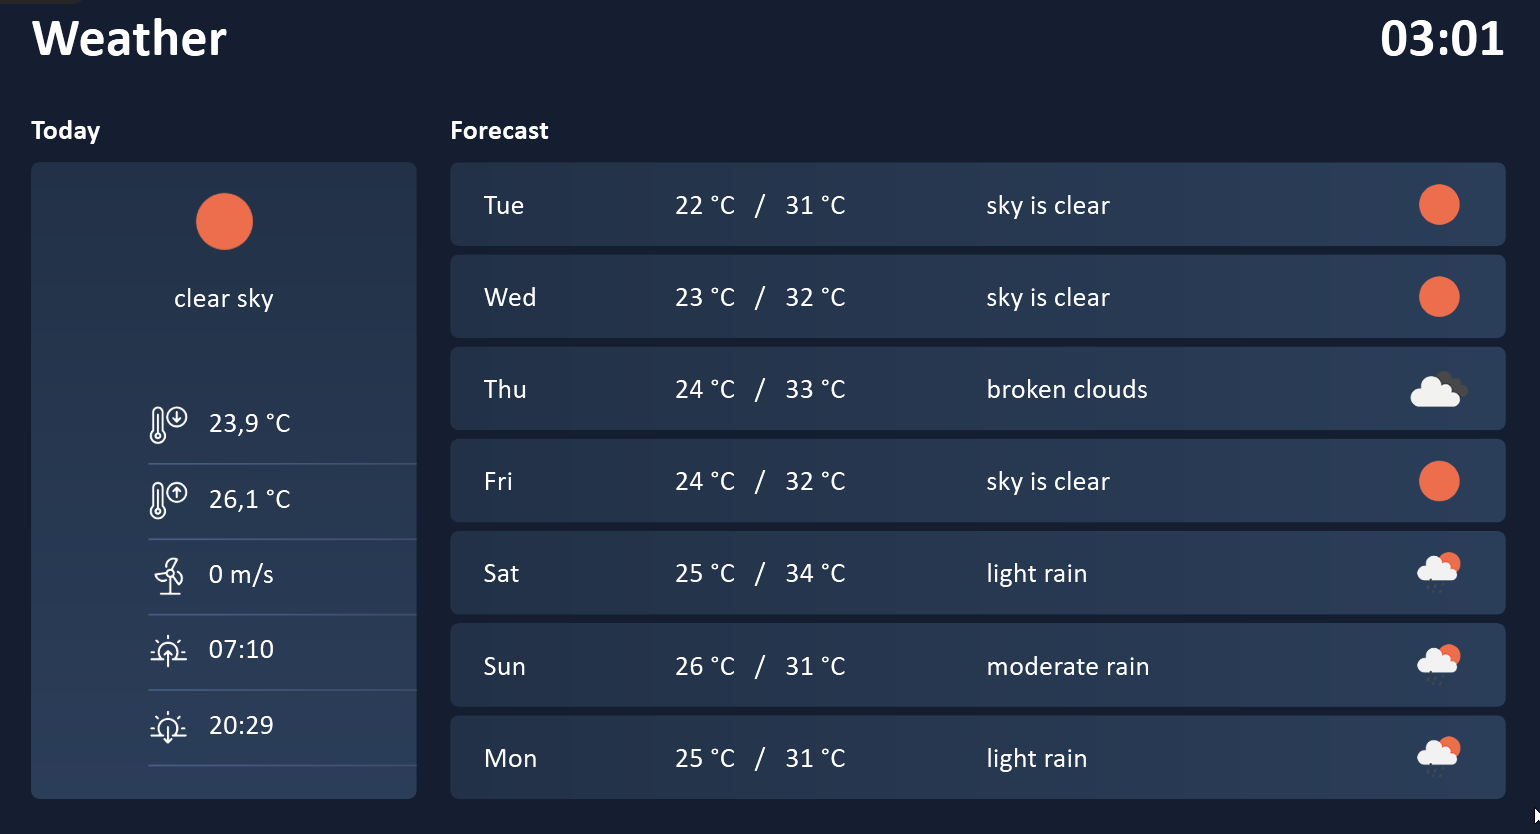
In this article, we’ll explain how to use the OpenWeatherMap API for the current weather, and how to build a weather forecast for the next few days. We will also discuss how to handle time formatting, and how to dynamically set an image, with LUA. Here’s a preview of the final result:
Account setup
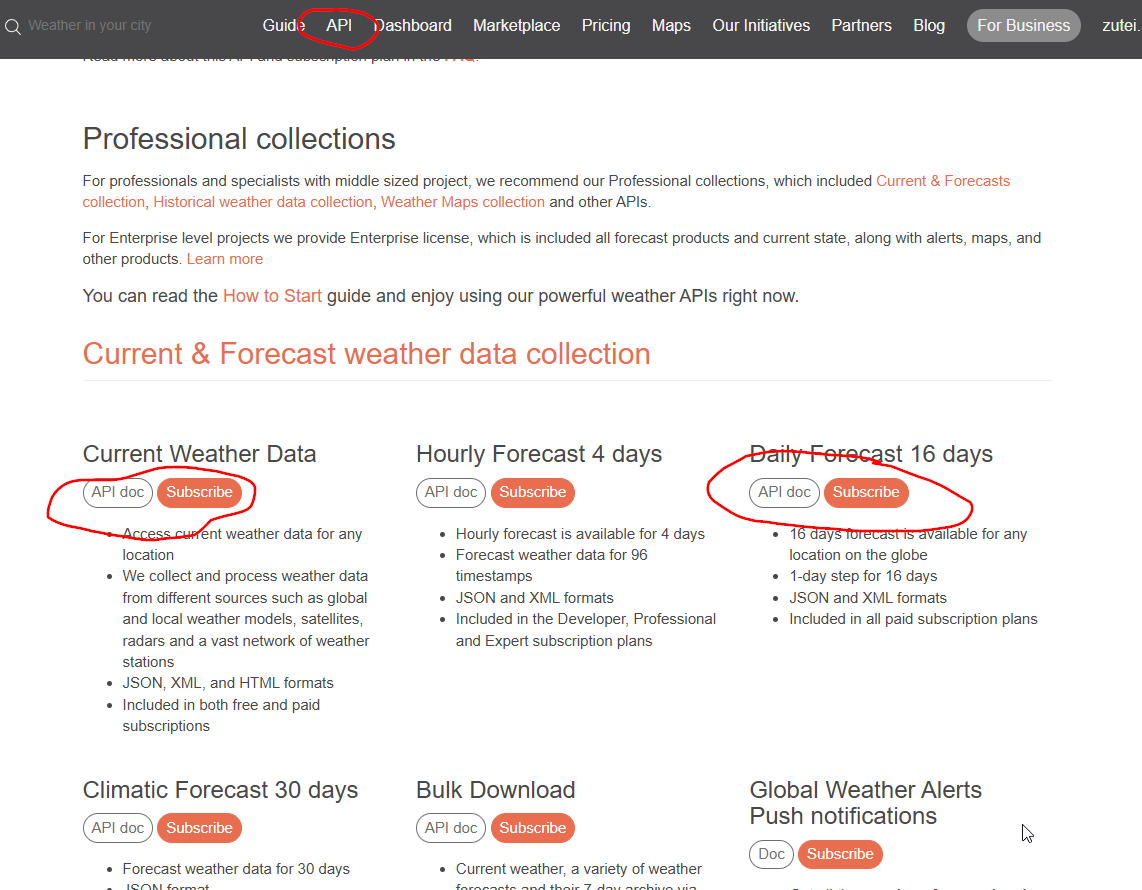
We first create an account at openweathermap.org. Next, we click the Subscribe buttons for our desired APIs:
- Current Weather Data
- Daily Forecast 16 days
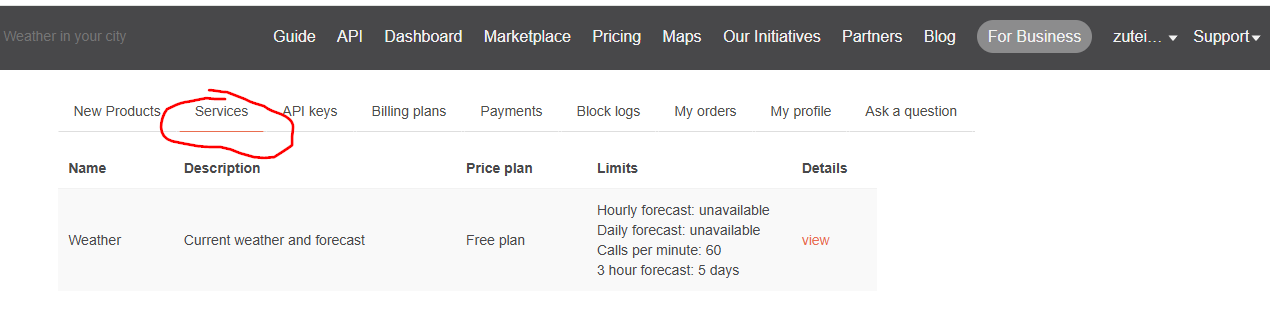
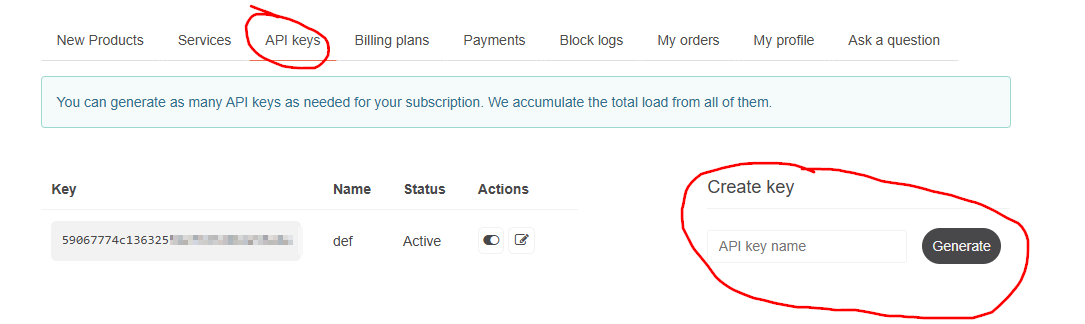
Next, we go to the API Keys tab. We generate a new API key and copy it down.
Prepare the current-weather data source
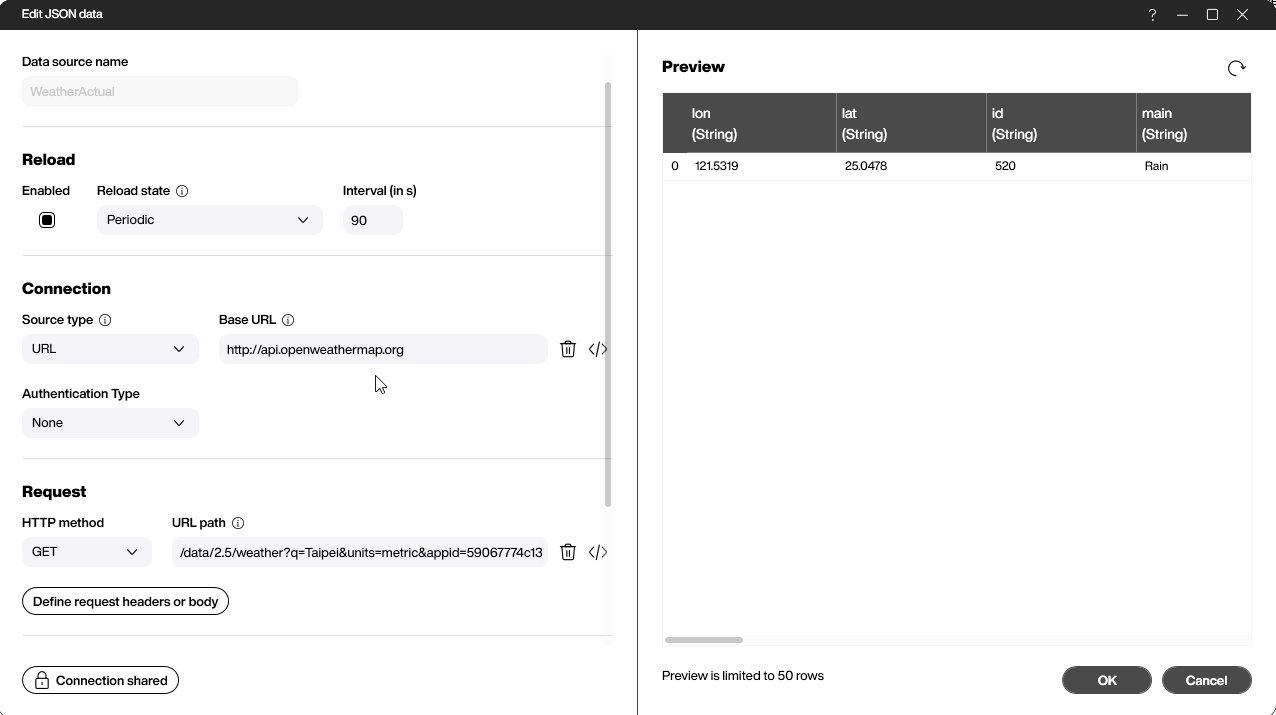
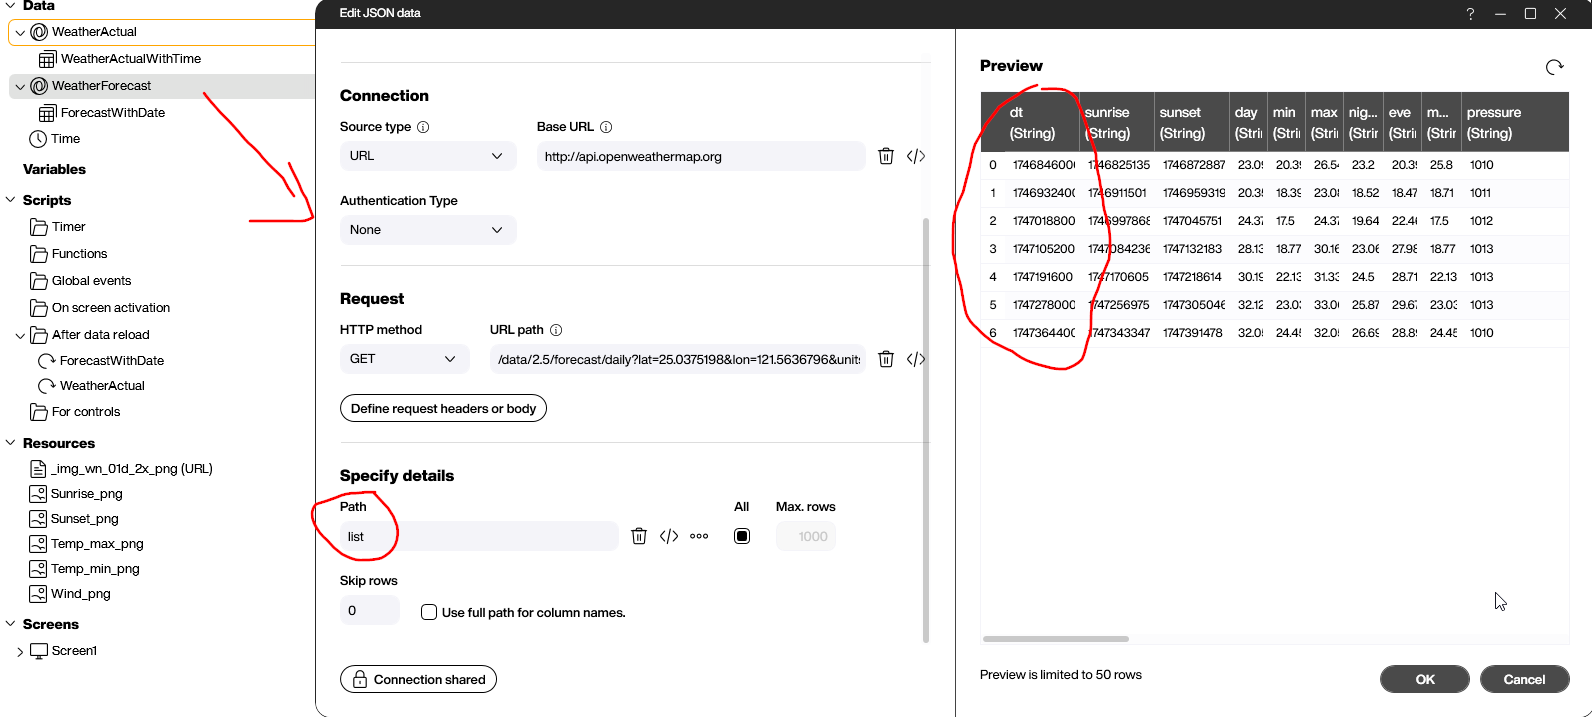
In Peakboard Designer, we create a new JSON data source. We will use this for our current weather API call.
This is the base URL:
https://api.openweathermap.org
This is the URL path:
/data/2.5/weather?q={city}&units=metric&appid={APIKey}
Replace {city} with the name of the city you want. Replace {APIKey} with your API key from earlier.
We also want metric units, so we set the units field to metric. The API also supports geographical coordinates and other features. To learn more, see the API docs.
Here is our API call. It generates a table with exactly one row. That row contains the weather data for the specified city.
http://api.openweathermap.org/data/2.5/weather?q=Taipei&units=metric&appid=59067774c1363255
Transform sunrise and sunset time
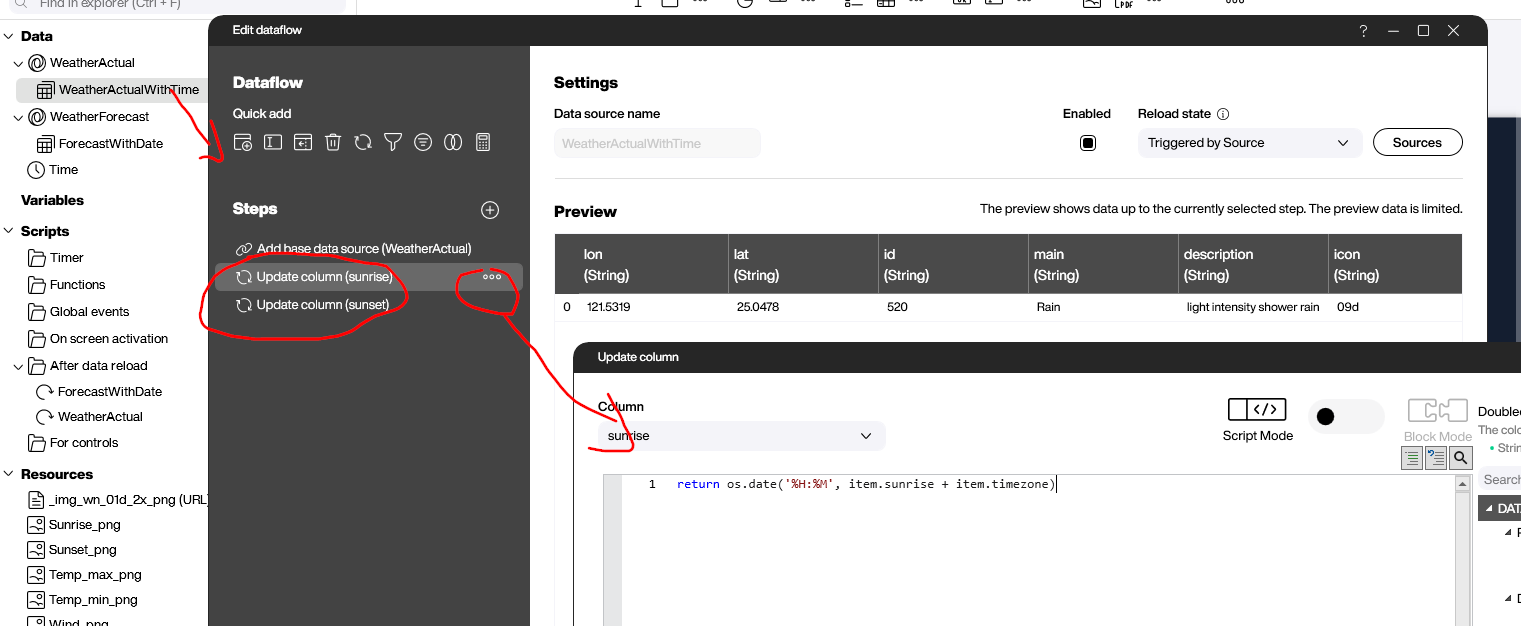
We need to transform the sunrise and sunset time into a properly-formatted local time string. But the API provides only Unix timestamps. So, we create a data flow below the original source and add a step to properly format and convert the time:
return os.date('%H:%M', item.sunrise + item.timezone)It’s a single line of LUA code. We convert the sunrise time to our desired timezone, and we format it as HH:MM. Then, we do the same for the sunset time.
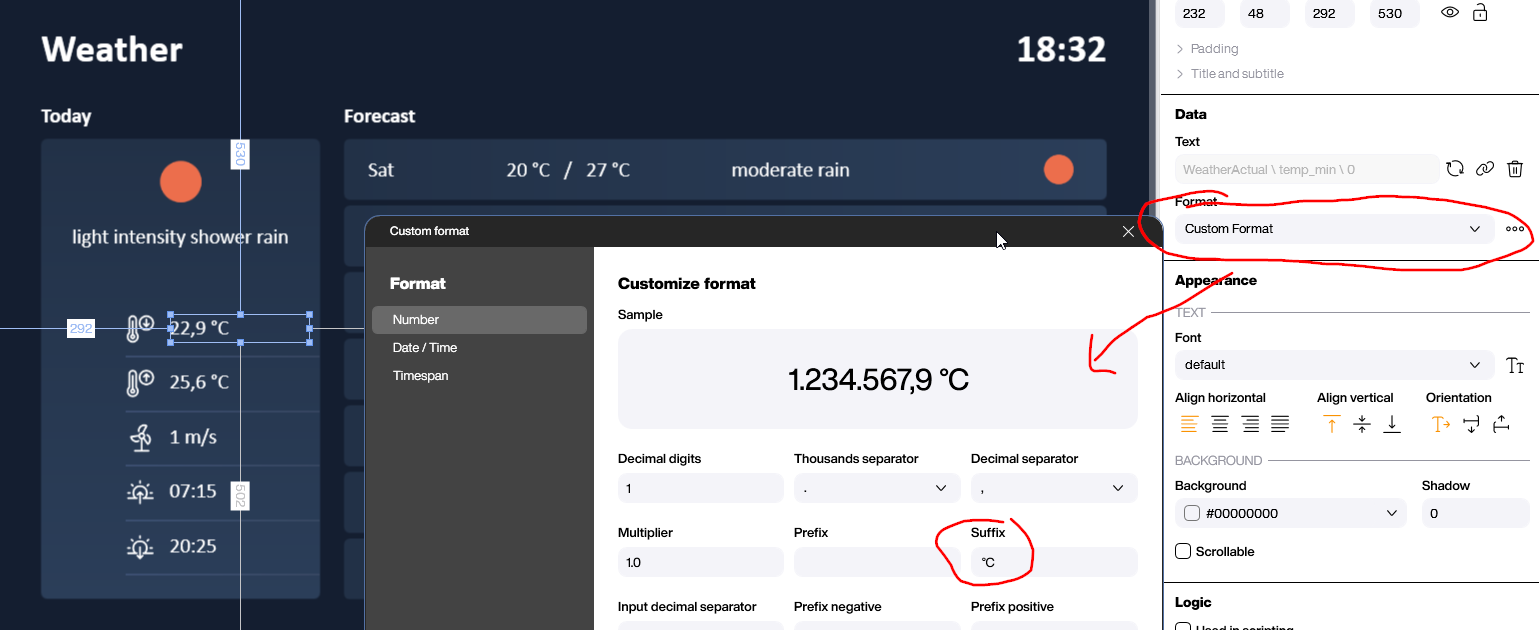
Add controls
To display the weather data to the user, we add icons and text boxes. We also set the appropriate suffixes, like the Celsius sign for temperatures.
Finally, we add the dynamic weather icons with an image control. The API returns a field called icon, which contains an icon code. We use that image code to get the appropriate icon, by plugging it into this URL:
https://openweathermap.org/img/wn/{code}@2x.png
So for example, this URL returns the “rain” icon (code 10d):
https://openweathermap.org/img/wn/10d@2x.png
We add building blocks for the refreshed event of the data source. This generates the icon URL and then sets the source of the image control to it:
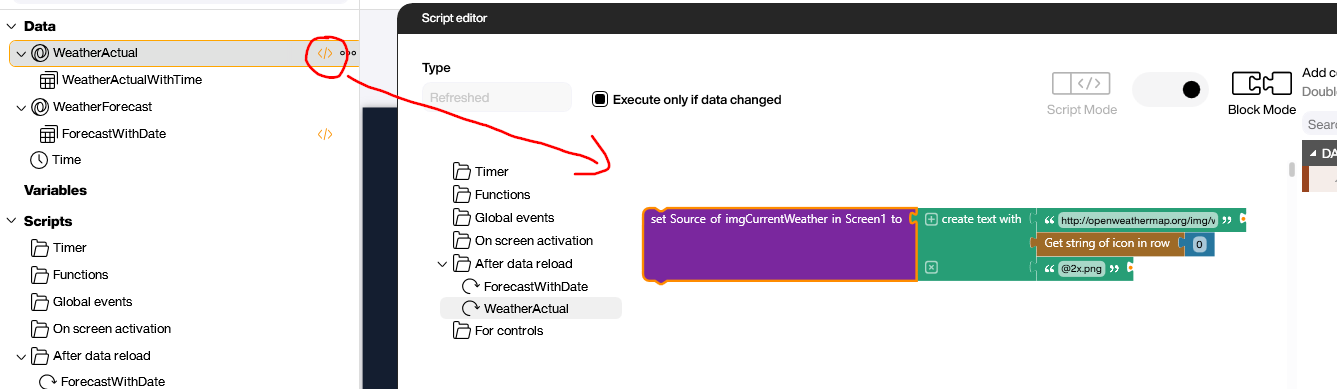
Here’s the LUA version:
screens['Screen1'].imgCurrentWeather.source = table.concat({'http://openweathermap.org/img/wn/', data.WeatherActual[0].icon, '@2x.png'})Prepare the weather forecast
For the daily forecast, we change the call slightly: We use forecast instead of weather, in the endpoint. The rest of the logic stays the same. This example shows how to use the geographical coordinates, instead of the city name:
http://api.openweathermap.org/data/2.5/forecast/daily?lat=25.0375198&lon=121.5636796&units=metric&appid=59067774c13632559
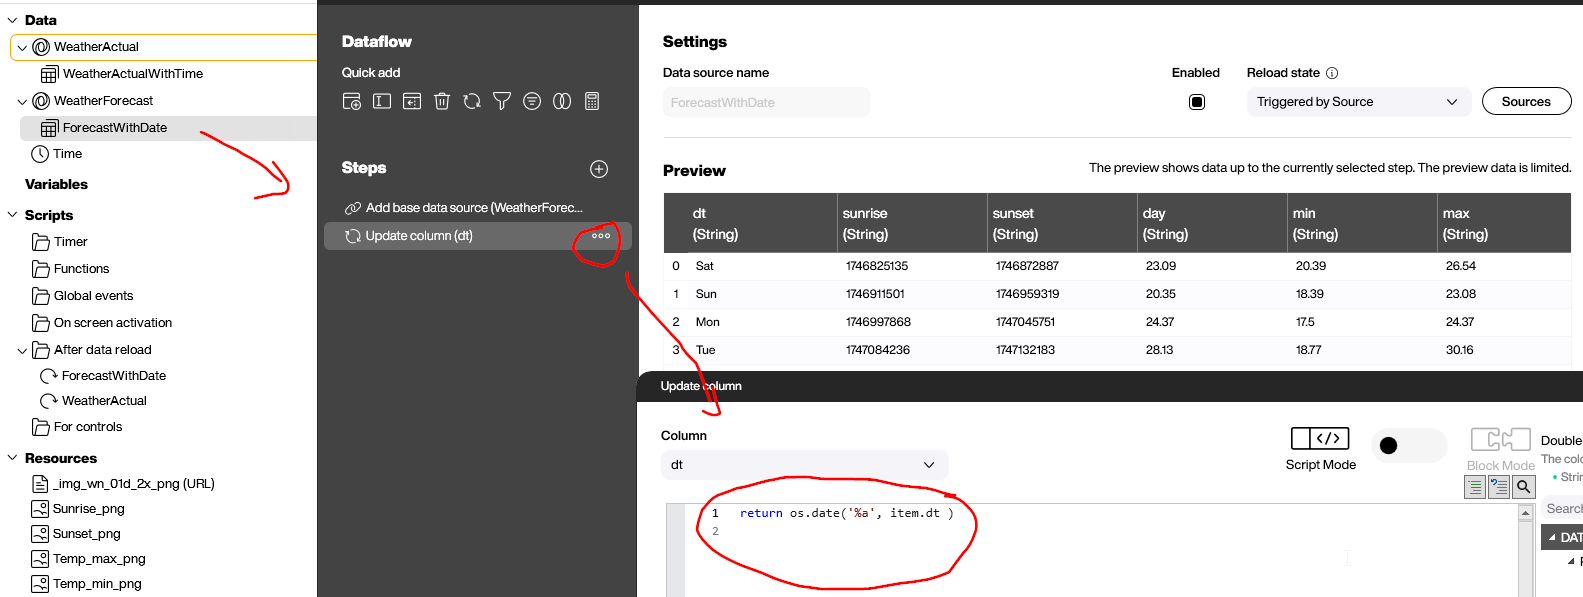
We want to present the daily forecast data as a list. So, we convert the Unix timestamp into a day of the week, and display it to the viewer. Just like with the current weather, we do that for the dt column in a data flow and use return os.date('%a', item.dt ) to update the column. The character %a represents the day of the week.
Next, we add a style list that generates an item for each row. The principle is the same as with the first data source. We add several formatted values, as well as an image control.
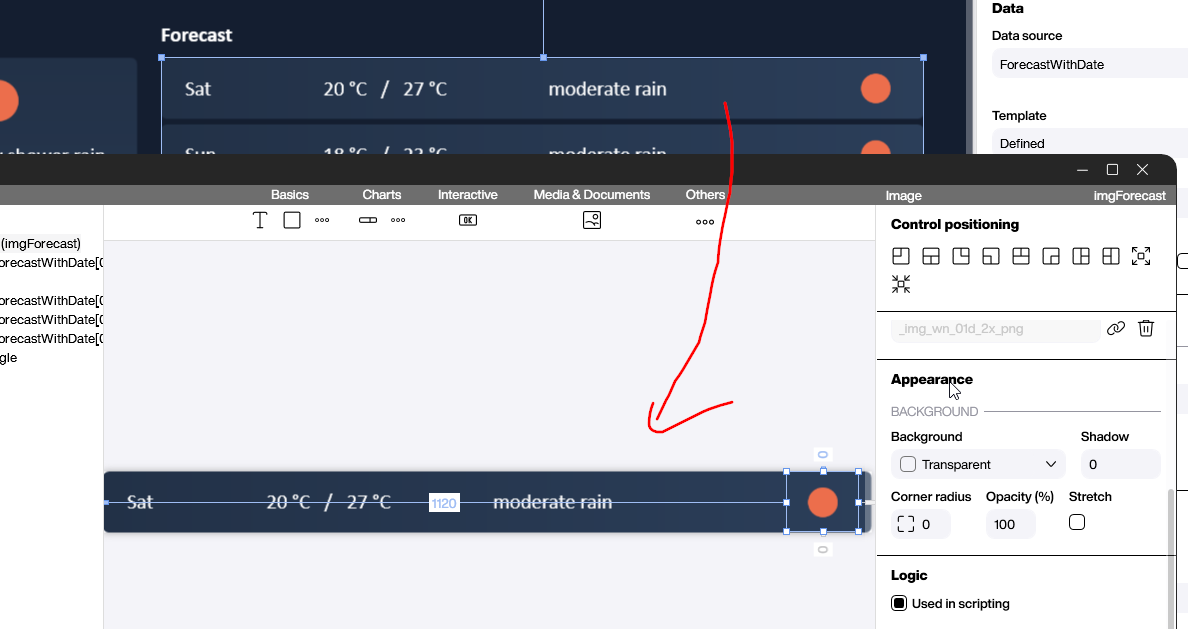
It’s not possible to bind the url of an image to an image control, like we do with the other columns of the data source. In order to set the image content to the dynamically generated URL, we use the refreshed script of the data flow.
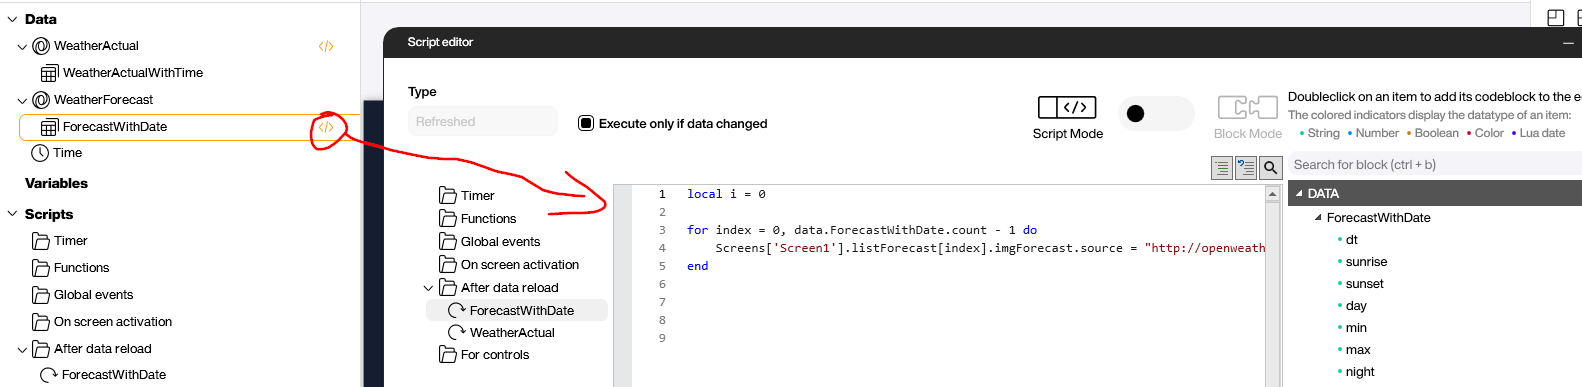
Here’s the LUA code. We loop over the table and set the URL for each instance of a forecasted day.
local i = 0

for index = 0, data.ForecastWithDate.count - 1 do
	Screens['Screen1'].listForecast[index].imgForecast.source = "http://openweathermap.org/img/wn/" .. data.ForecastWithDate[index].icon .. "@2x.png"
end
Result and enhancements
As you can see, it’s easy to use the OpenWeatherMap API. There are many other features that we did not mention. For example, different styles of icons, wind, gusts, other weather phenomena, and temperature curves. There are also many other API endpoints listed in the API documentation.