Over two years ago, we published two articles about Shelly products: One about how to use the button and another about how to use the power plug. A lot of time has passed since then, and many readers have come back and have actually used Shelly products in a professional industrial environment.
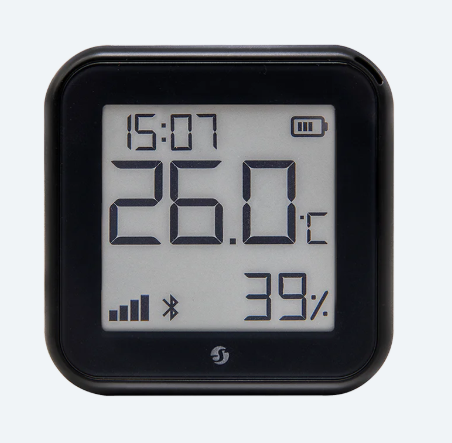
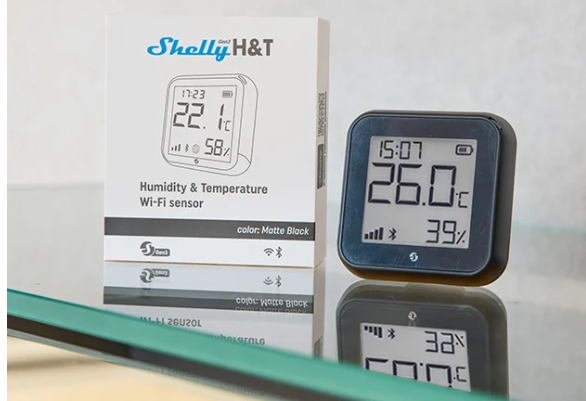
Today, we’ll take a closer look at a relatively new product: The Shelly Humidity and Temperature sensor. It comes with an e-ink display and supports a Wi-Fi connection. To learn how to configure the Wi-Fi connection during the initial setup, see the official documentation.
In our example, we’ll use MQTT to build a Peakboard dashboard that displays the current temperature and humidity from the Shelly sensor. We’ll also store the values in Peakboard Hub and build charts to analyze the historical data.
Shelly sensor configuration
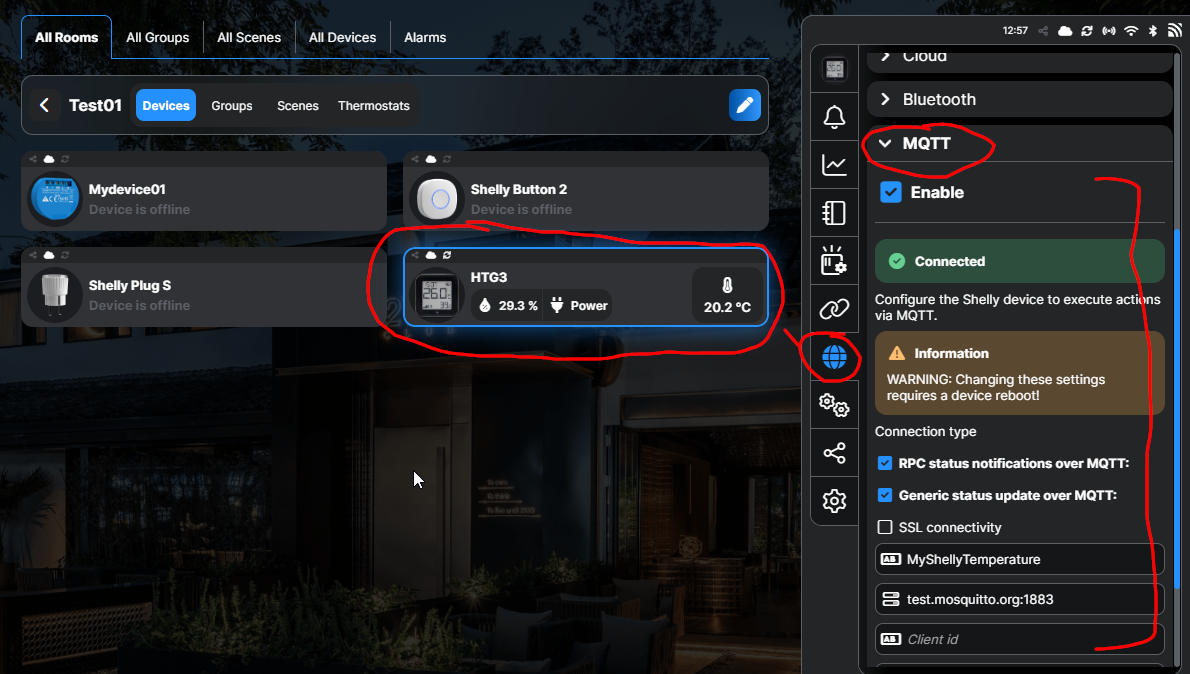
Our Shelly sensor offers two options for configuration. It comes with a built-in web interface that can be accessed during the setup process (see the official documentation). The configuration can be also done through the Shelly cloud services, provided that it’s configured properly. However, if it’s necessary to avoid any kind of outside connection due to security restrictions, then a cloud connection can be avoided (it’s not mandatory).
The following screenshot shows the cloud-based configuration dialog. The only thing we need to configure here is the MQTT connectivity. We use a public MQTT broker, but a private one does the same. Besides the address, we also need to provide a suffix, which determines the MQTT topic.
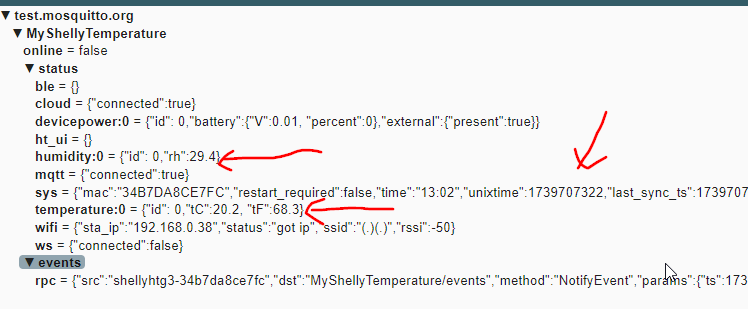
The sensor sends multiple MQTT messages every couple of minutes. Besides metadata and health information, we can also find the temperature and humidity, along with a Unix timestamp with the exact time of the last measurement. The following screenshot shows the MQTT message, in MQTT Explorer.
It’s important to note that the Shelly sensor goes to sleep in between the two measurements, to save energy. It evens disconnects from Wi-Fi during that time. So we usually can’t ping the sensor within the local network.
Build the Peakboard app
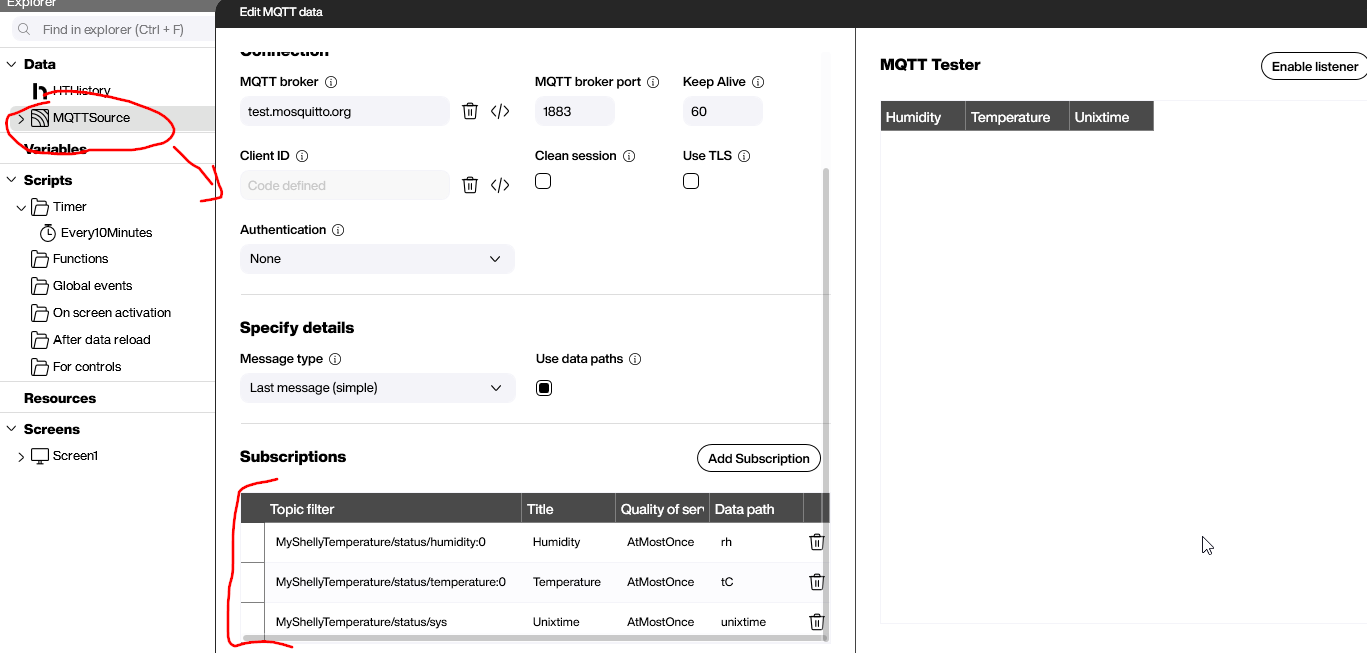
On the Peakboard side, we need an MQTT connection. As shown in the following screenshot, we subscribe to three different topics: temperature, humidity, and time.
MyShellyTemperature/status/humidity:0MyShellyTemperature/status/temperature:0MyShellyTemperature/status/sys
We then use the data path to find the desired value within the JSON message.
In order to turn the Unix timestamp into a properly formatted value, we use a data flow, along with single line of LUA code:
os.date("%Y-%m-%d %H:%M:%S", tonumber(item.Unixtime))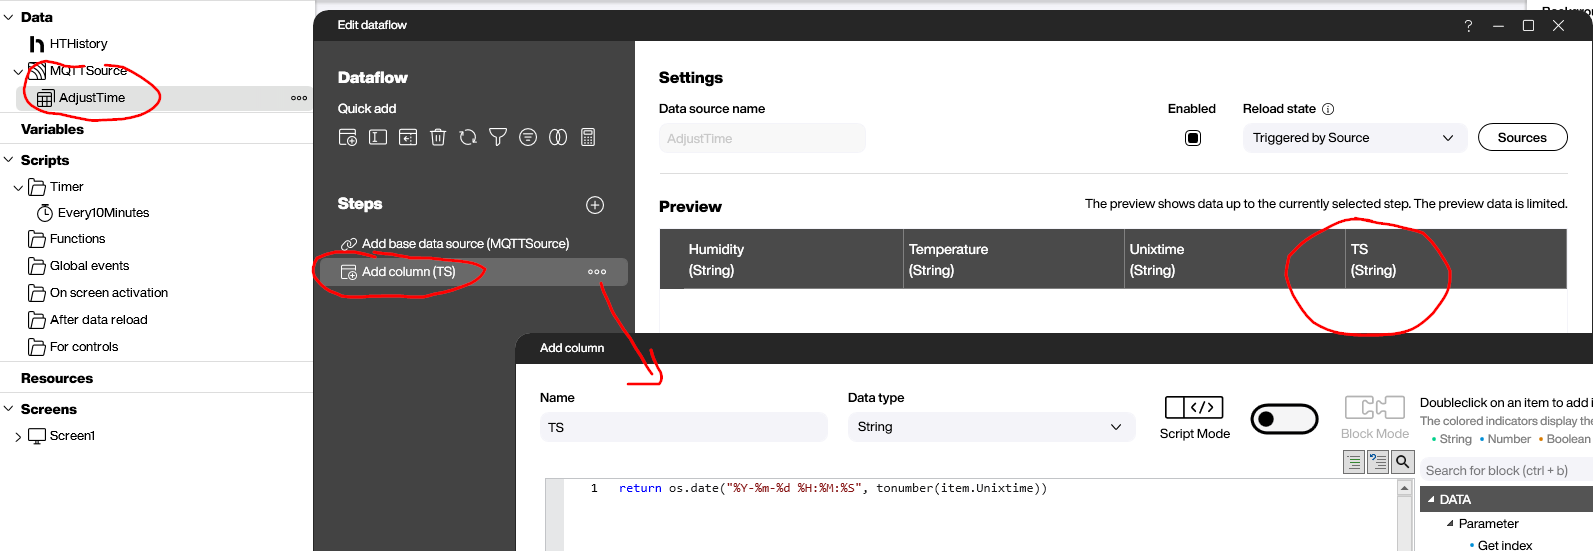
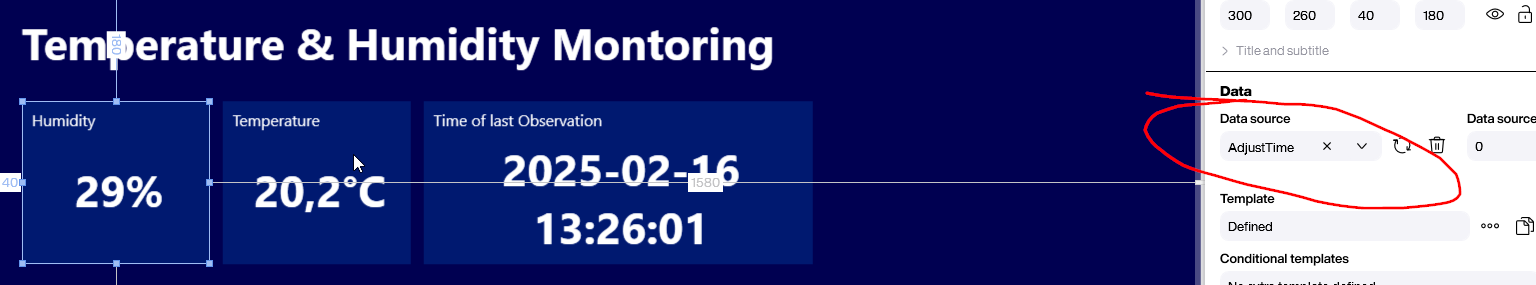
To display the values to the user, we use tiles, bind it to the source, and make sure the data is formatted correctly with a unit.
Historical analysis
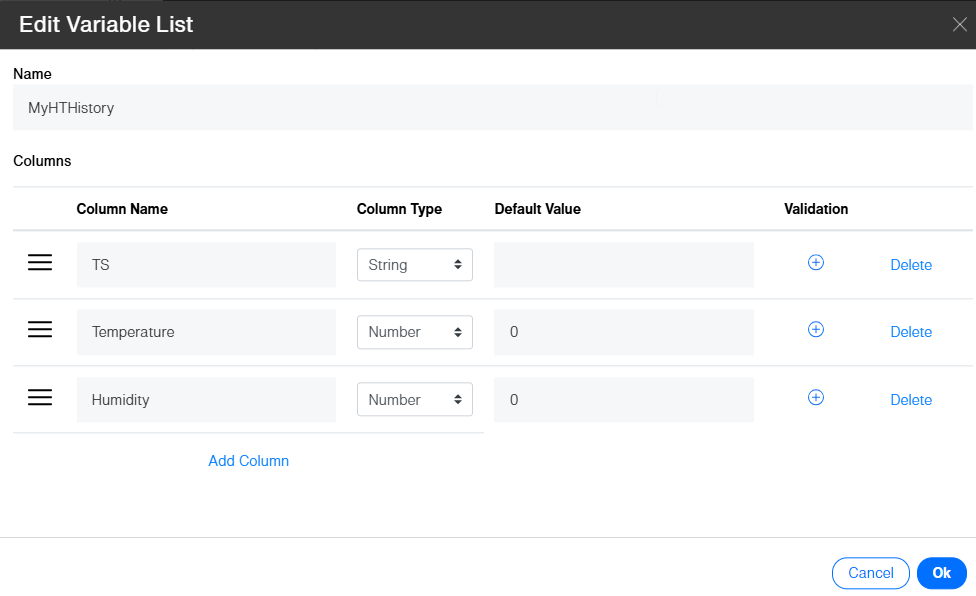
To store the values for future analysis, we create a list in Peakboard Hub. We add a timestamp column and two integer columns for the temperature and humidity.
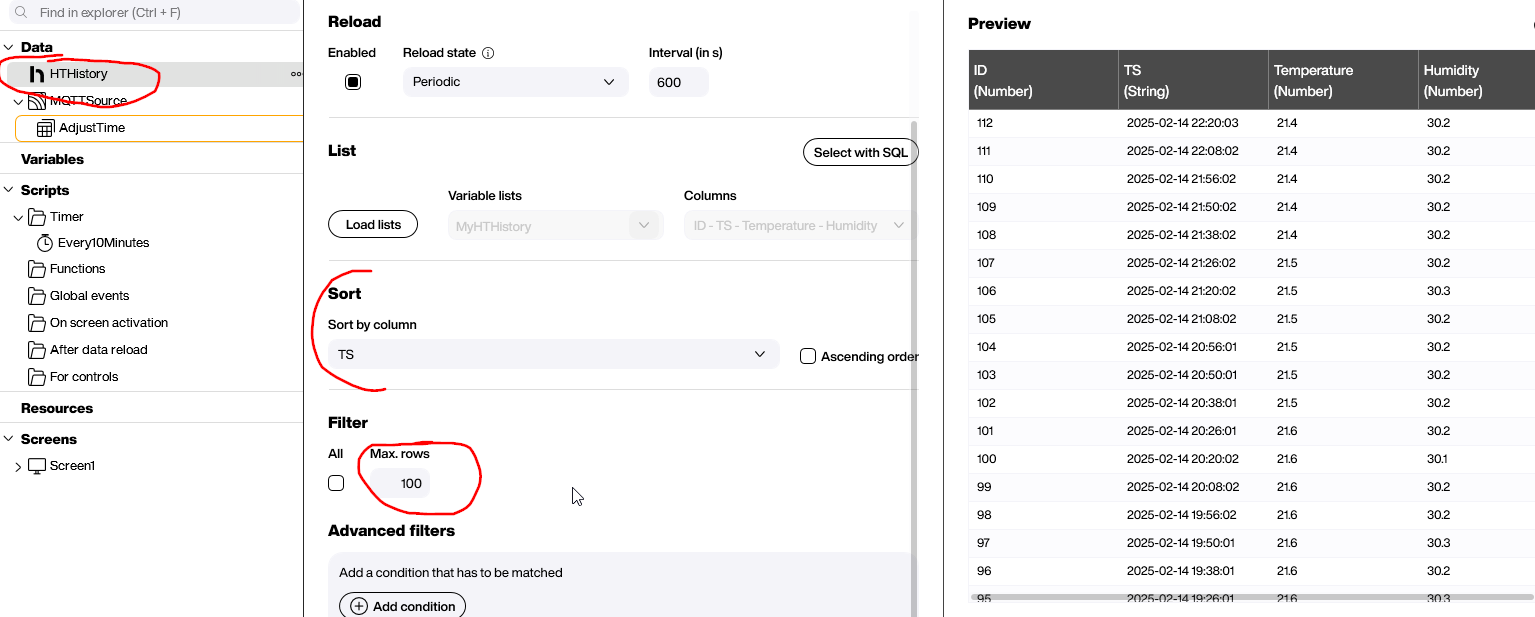
In the Peakboard app, we set up a data connection to this Hub list and query the last 100 records. This will supply the data for our historical data charts.
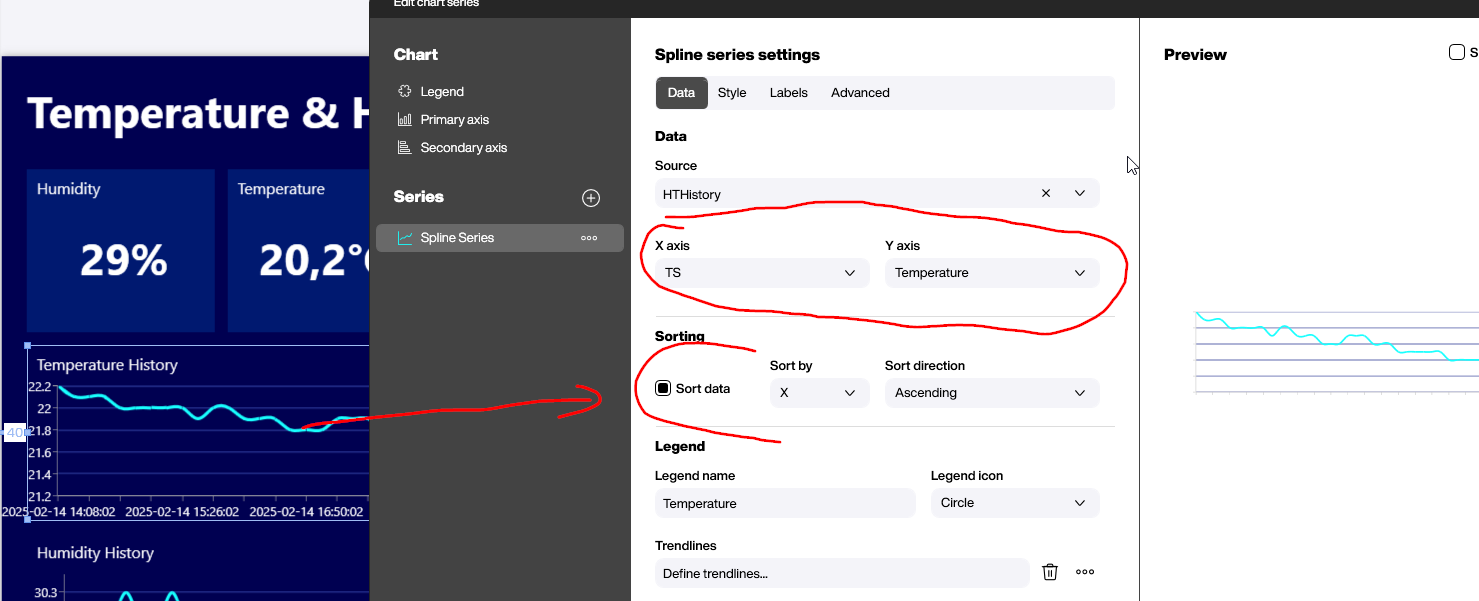
For our charts, we use a simple line chart and connect it to the Hub list data connection. In our example, we have two separate charts: one for temperature and one for humidity.
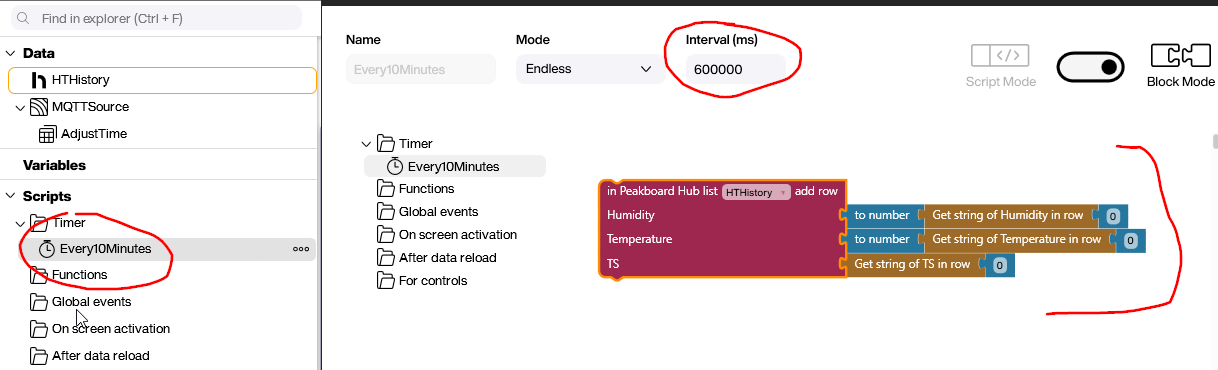
The last thing we need is to write the current values regularly to the Hub list. To do that, we set up a timer that triggers every 10 minutes and takes the value from the data flow and appends in to the list:
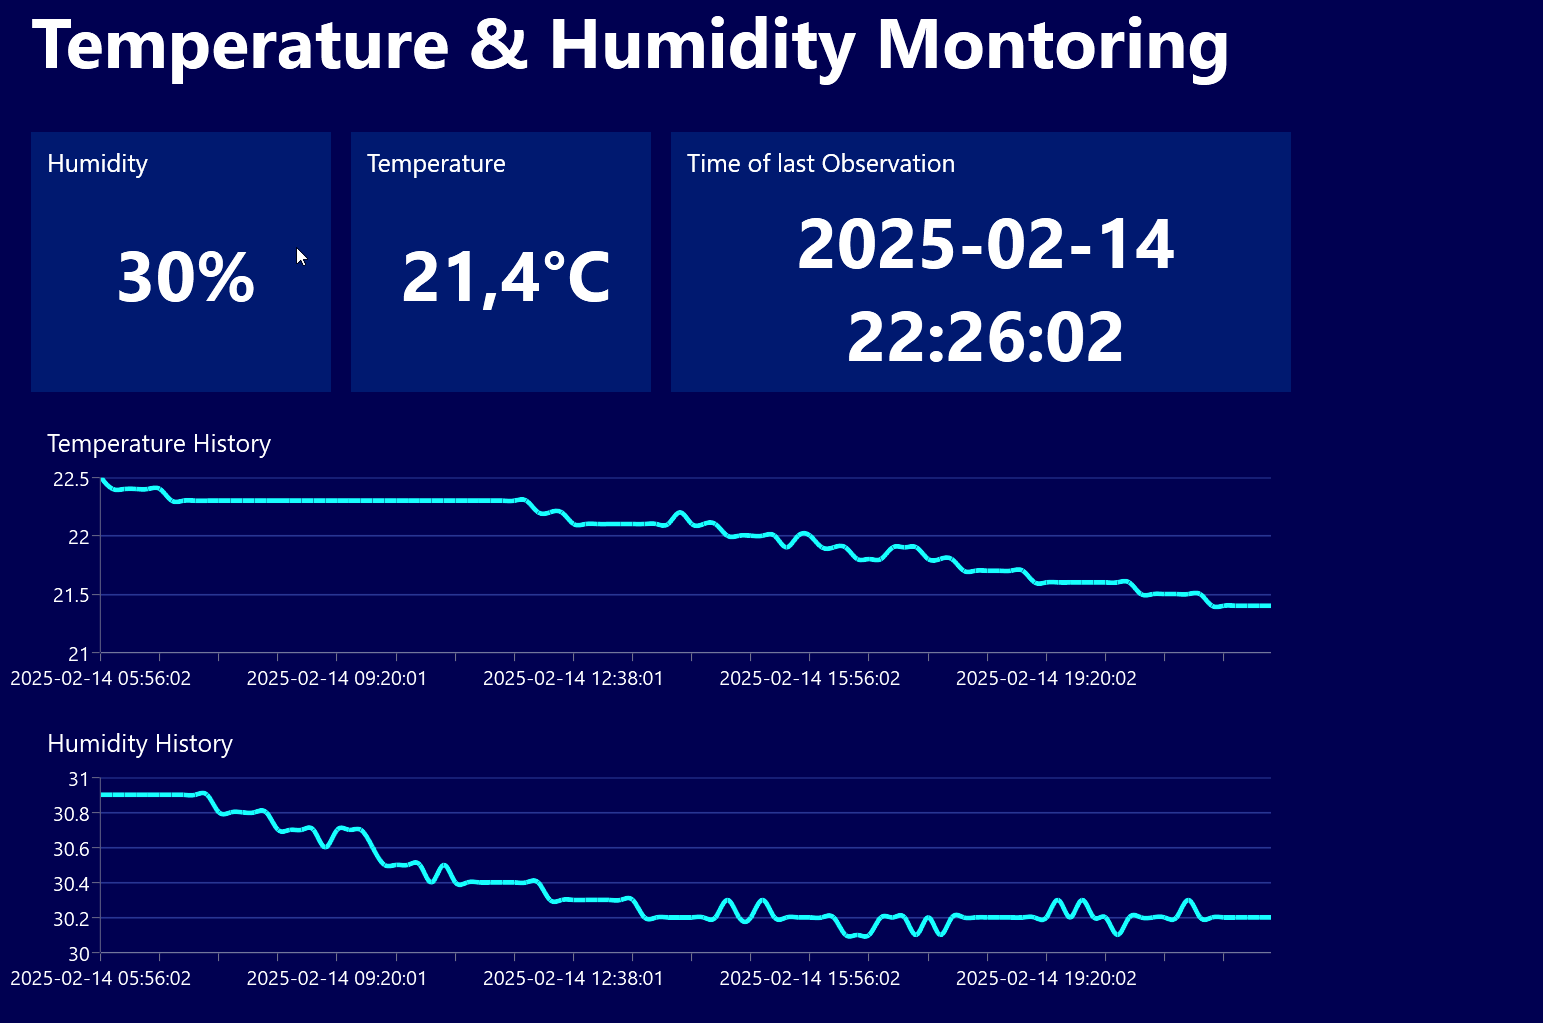
Result
The following screenshot shows the final result in action. The real-time data is sent from the Shelly H&T sensor to Peakboard, via MQTT. On a regular basis, these values are stored in a Hub list. The Hub list is also queried to create the historical data charts, which show the last 100 data points.