
The Microsoft Graph API is the unified gateway to almost everything in the Microsoft 365 ecosystem. Whether it is users, groups, calendars, Teams messages, SharePoint lists, or - as in this article - Microsoft Planner, the Graph API exposes all of it through a single, consistent REST interface. Peakboard already ships with a whole set of built-in data sources for the most common Microsoft 365 scenarios, like calendars, Outlook, Teams, ToDo, and SharePoint lists. These cover a lot of ground out of the box, and for many projects they are all we need. The idea behind the Graph extension is to go beyond these built-in connectors and solve problems that they simply do not cover - and Microsoft Planner is a perfect example of exactly such a case. In this article, we will look at how to access Microsoft Planner from a Peakboard application using the Graph API, so we can turn our Planner boards into live, shop-floor-ready Kanban dashboards. One important note up front: there is an older Graph extension available here, but it is no longer usable and only works with Peakboard versions below 4.1. From version 4.1 onwards, there is a new Graph extension that we will be using throughout this article, available here.
Setting up the Azure Entra app
Before we can talk to the Graph API at all, we need an Azure Entra app registration. This is the application identity that Peakboard uses to authenticate against Microsoft 365 and to request the permissions it needs to read and write Planner data. Setting this up correctly is a one-time effort, and the whole process - registering the app, configuring the API permissions, and granting admin consent - is documented in detail in the Microsoft Graph extension repository. We recommend walking through that setup first and keeping the resulting client ID, tenant ID, and secret handy, because we will need them when configuring the data source.
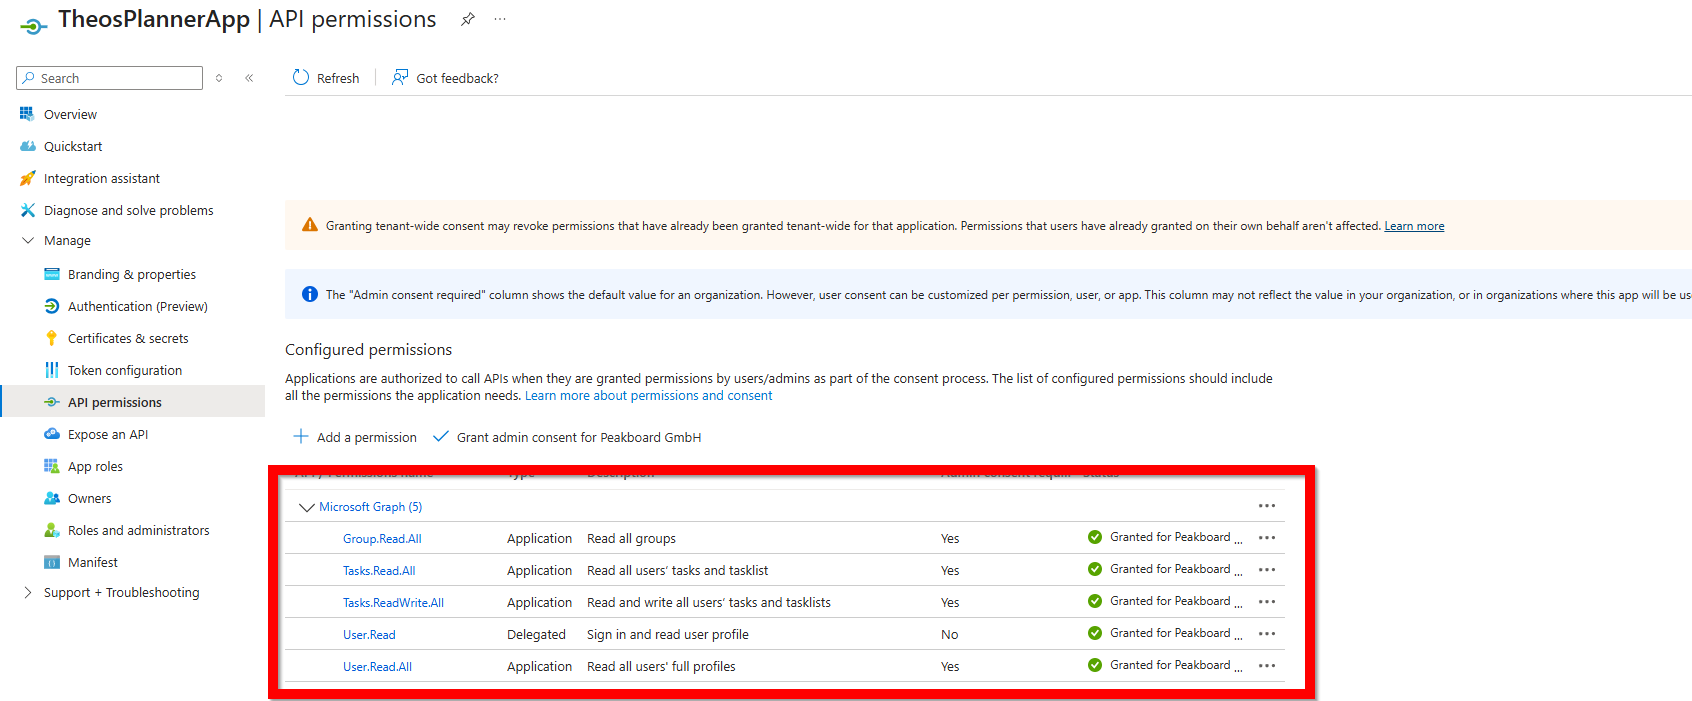
The crucial part of the app registration is the set of API permissions we grant it. For our Planner scenario we need a handful of Microsoft Graph permissions. Tasks.Read.All and Tasks.ReadWrite.All give us read and write access to the Planner tasks and task lists, which is the core of what we want to do. Group.Read.All is needed because Planner plans live inside Microsoft 365 groups, so we have to be able to resolve those groups. Finally, User.Read and User.Read.All let us resolve the users that tasks are assigned to, so we can display real names on our board instead of cryptic IDs. All of the application permissions require admin consent, so we need to make sure they show up as granted before moving on.
Understanding the Planner object model
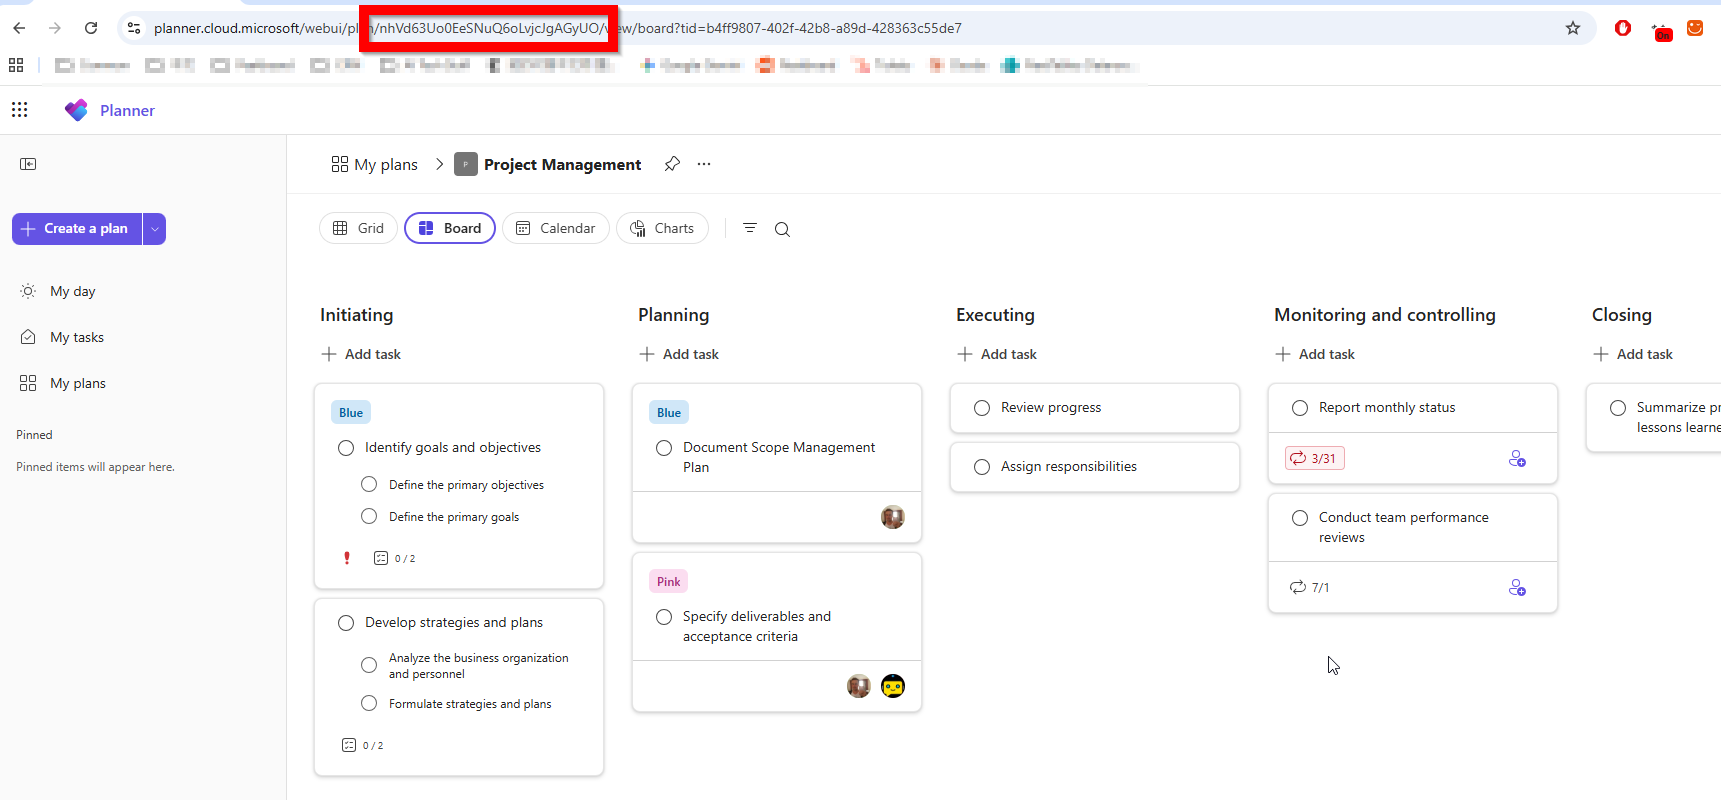
Before we start pulling data, it helps to understand how the Planner objects relate to each other. At the top sits the Microsoft 365 group - every plan belongs to exactly one group. A plan is the actual Kanban board, and within a plan the columns we see are called buckets (in the screenshot below: Initiating, Planning, Executing, and so on). The individual cards are the tasks, and each task is assigned to exactly one bucket. So the hierarchy is simply group → plan → bucket → task. The Graph extension mirrors this model directly: it provides a separate list for each of these objects - groups, plans, buckets, and tasks - so we can query them individually and then join them together in Peakboard. To address a specific plan we need its plan ID, which we can conveniently read straight from the URL when we open the board in the Planner web app.
Setting up the data source
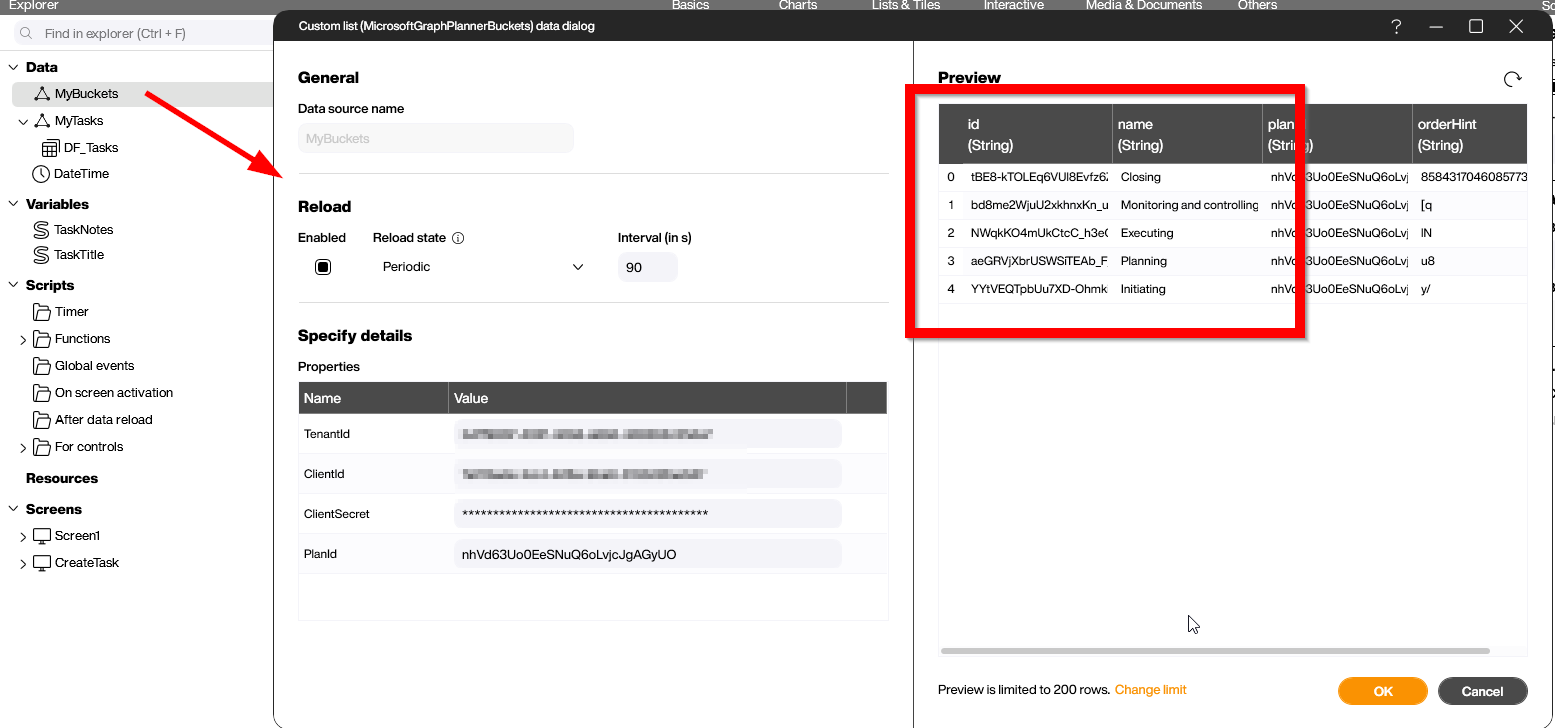
With the plan ID in hand, we can now wire up the actual data sources. We start with the buckets, using the MicrosoftGraphPlannerBuckets list from the extension. We just fill in the four properties - tenant ID, client ID, client secret, and the plan ID we grabbed from the URL - and the preview immediately shows us the buckets of our plan with their internal ID, the display name, and an order hint.
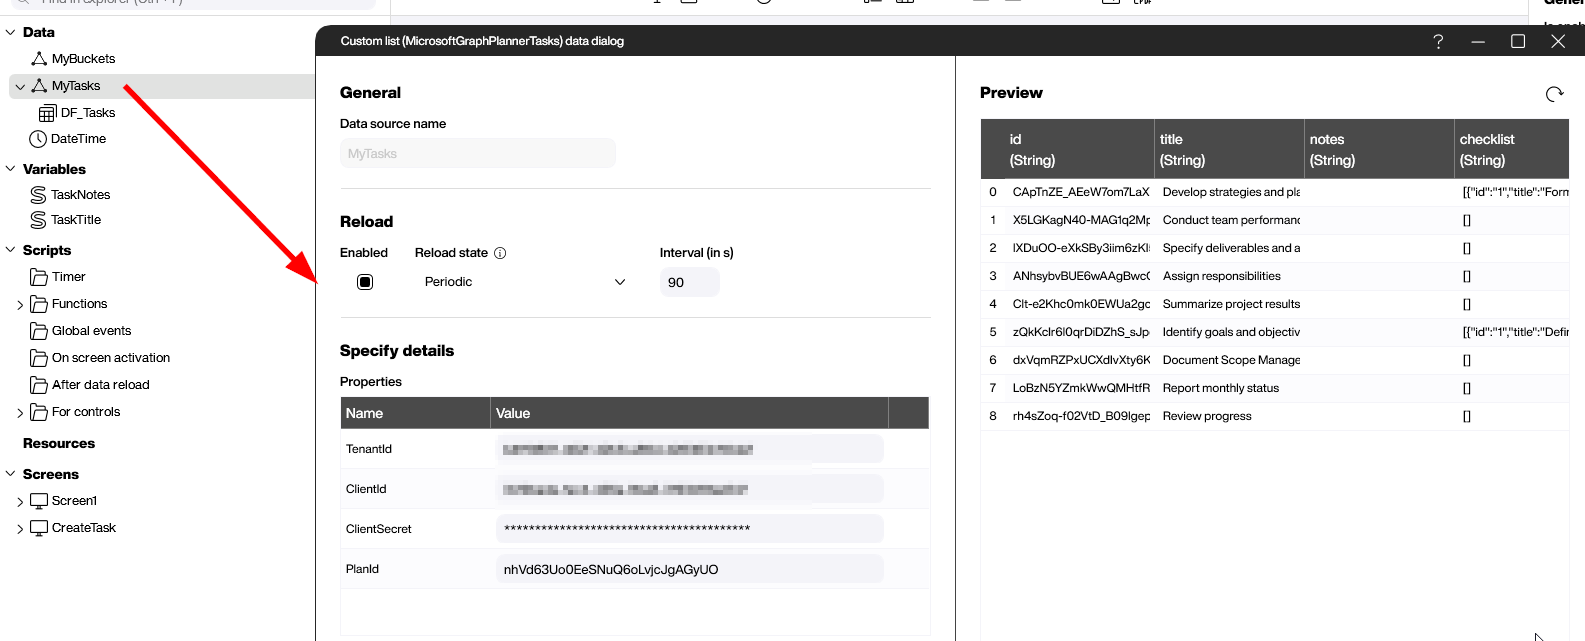
The tasks themselves work exactly the same way, this time with the MicrosoftGraphPlannerTasks list and the very same connection properties. The preview gives us all the task metadata we care about - the title, notes, the checklist, and a whole lot more - one row per card on the board.
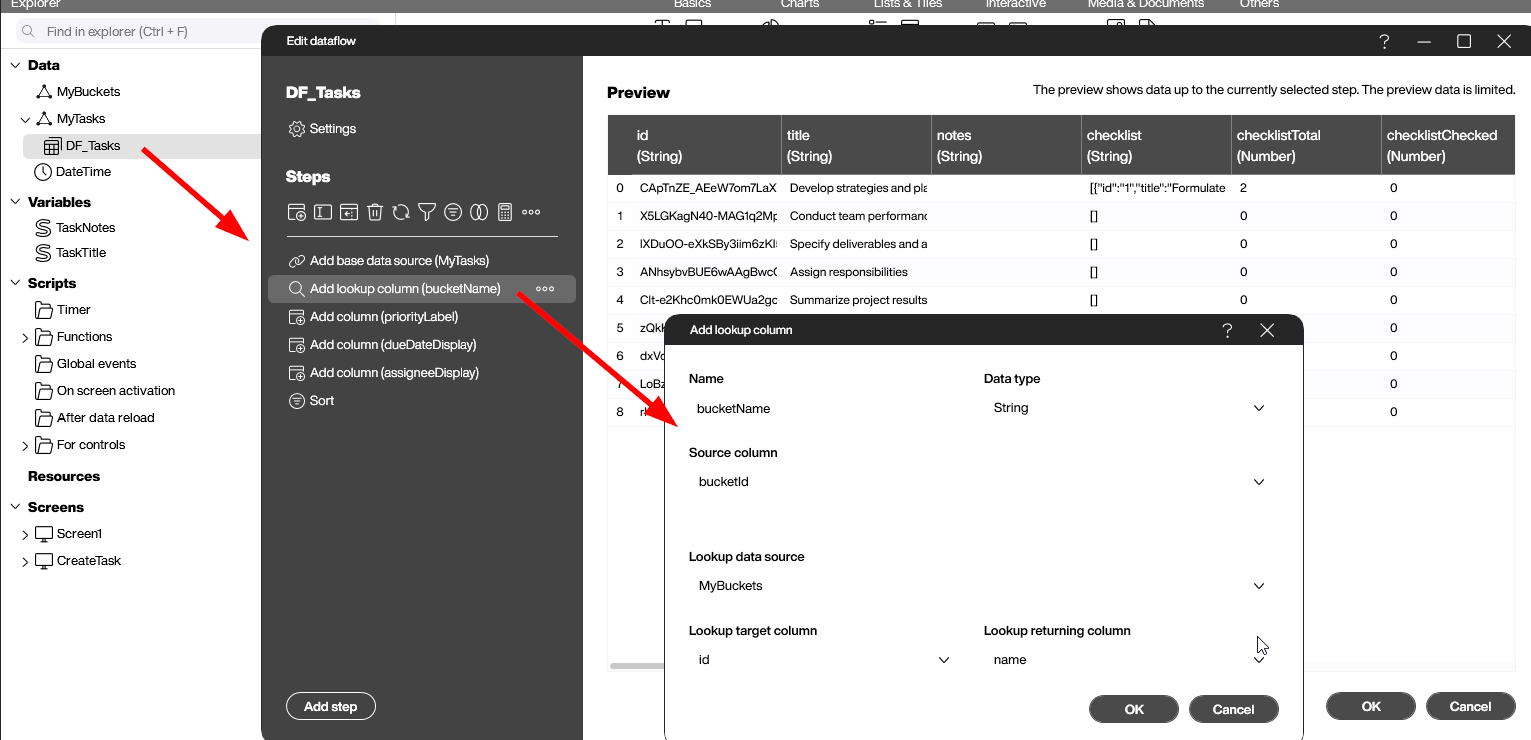
The raw task data is technically complete, but not very friendly to work with yet. That is why we put a small dataflow on top of the tasks list to massage the data into something more usable. A good example is the bucket: a task only carries a bucketId, which is a meaningless string for the end user. With a simple lookup step against our buckets list, we translate that ID into the proper bucket name, so we can later show “Executing” instead of a cryptic identifier.
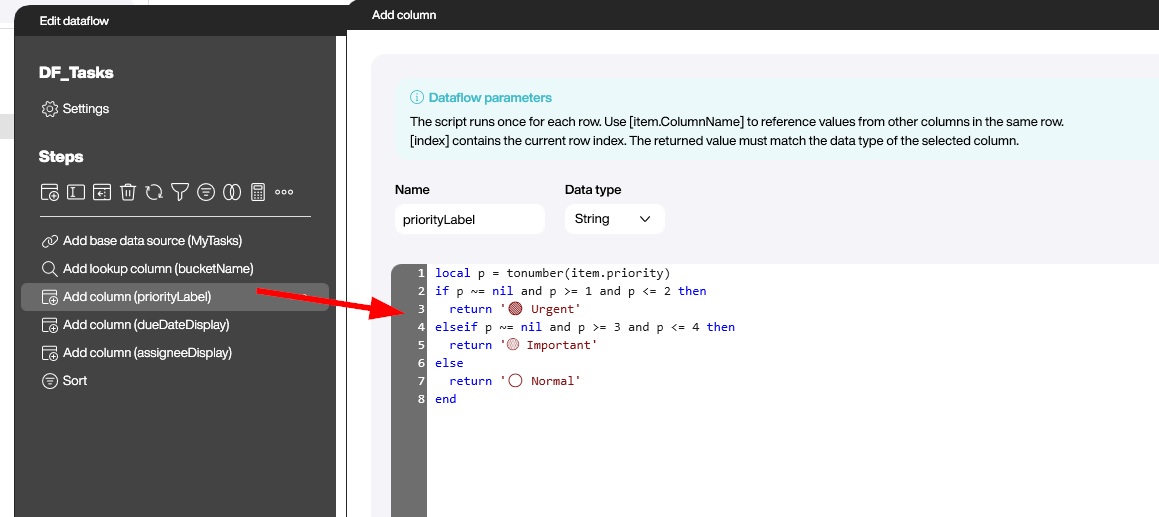
We apply the same idea to a few other fields. The priority, for instance, arrives as a plain number that nobody wants to see on a dashboard. With a short script column we translate it into a meaningful label - Urgent, Important, or Normal - and even prefix it with a colored symbol so the priority jumps out at a glance.
Working with checklists
A Planner task can also contain a checklist with its individual sub-items. Whenever a task has one, it is delivered as a single JSON string in the checklist column, looking something like this:
[{"id":"1","title":"Formulate strategies and plans","isChecked":false,"orderHint":"WI"},{"id":"0","title":"Analyze the business organization and personnel","isChecked":false,"orderHint":"jO"}]This is just plain JSON, so we have all the usual options to get at the data. If we want to work with the individual checklist items as proper rows, we can drop a “Parse JSON” step into a dataflow and let Peakboard expand the string into a structured list. Alternatively, if we need more control or want to do something custom with the items, we can simply parse the string in a script. Whichever route fits the use case better, the checklist data is fully accessible.
Presenting the data
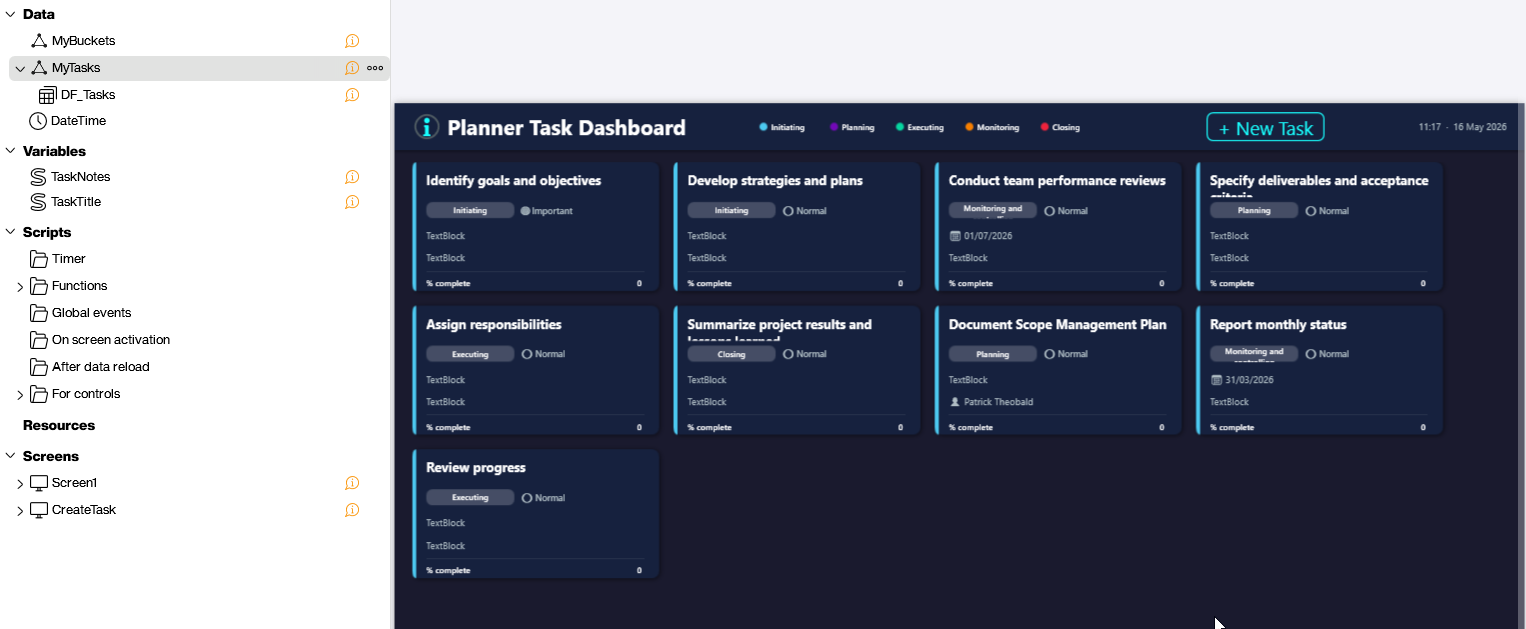
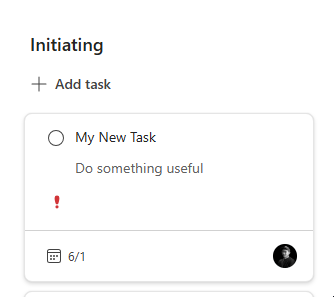
How the prepared data is finally presented is completely up to the use case - the example below is just one of many possibilities. Most of the time a styled list or a tile view is used to display the tasks in a clean, dashboard-friendly way.
Creating a new task
So far we have only read data, but the extension also lets us write back to Planner. With the createTask function we can create a brand new task right from a Peakboard application. We just call the function as a Building Block and pass in the relevant parameters - the title, notes, the target bucket ID, a due date, the assignee IDs, and the priority.
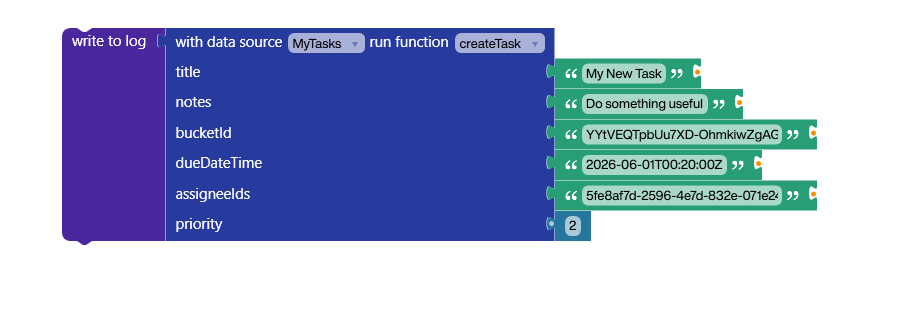
A moment later the new task shows up in Planner exactly where we put it, with all the values we passed in. From here on it behaves like any other task on the board.
Creating tasks is not the only write operation. The extension offers a second Planner function that lets us move a task from one bucket to another - perfect for building a touch-friendly board where an operator can advance a task to the next stage with a single tap.
Conclusion
Microsoft Planner is a great example of how far we can push Peakboard beyond its built-in data sources. While the native connectors for calendars, Teams, ToDo, and SharePoint cover the most common Microsoft 365 scenarios out of the box, the Graph extension fills in everything else - and Planner is just one of many endpoints we can tap into this way. With a properly configured Azure Entra app, a couple of lists, a bit of dataflow polishing, and the write-back functions, we can turn a plain Planner board into a live, interactive shop-floor dashboard. Whenever the built-in data sources do not quite reach far enough, the Graph extension is the natural next step to extend them.