Before we touch a single piece of Peakboard, let’s quickly clarify what we are actually dealing with. LoRaWAN (Long Range Wide Area Network) is a low-power wireless protocol designed for small amounts of data over very long distances, sometimes several kilometers in open terrain. The radios are cheap, the batteries last for years, and the data rates are tiny by modern standards. That combination is exactly what we want for sensors out in a warehouse, on a remote machine, in a parking lot, or anywhere else where pulling a cable or relying on Wi-Fi is impractical.
The Things Network (TTN) is a community-driven, openly accessible LoRaWAN network. Instead of building and operating our own gateways, we can use existing community gateways and let TTN’s infrastructure handle the network server, the authentication, and the message routing for us. Every sensor we register lives in an application on TTN, and TTN forwards the decoded payloads to wherever we want them, including MQTT, which is exactly the bridge we are going to use here.
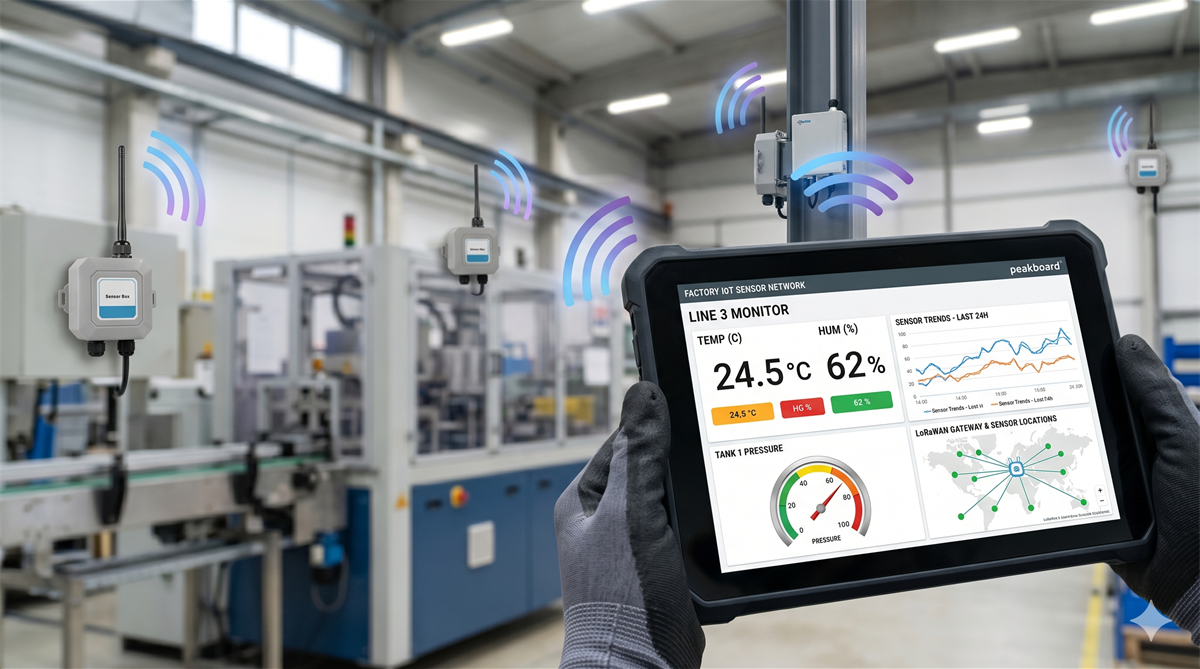
In this article we walk through how to connect a sensor to The Things Network and integrate the resulting data stream into Peakboard. We will use the Dragino LHT65SE3, a LoRaWAN temperature and humidity sensor with an external probe, as our example device. We deliberately do not cover the TTN onboarding side in detail here, because somebody else has already written a very thorough walkthrough on exactly that topic. If we still need an account, an application, or a registered end device, the linked Medium article at the top of this post is the best place to start. Once that part is in place, we are ready to pull the data into Peakboard.
Getting the device talking to TTN
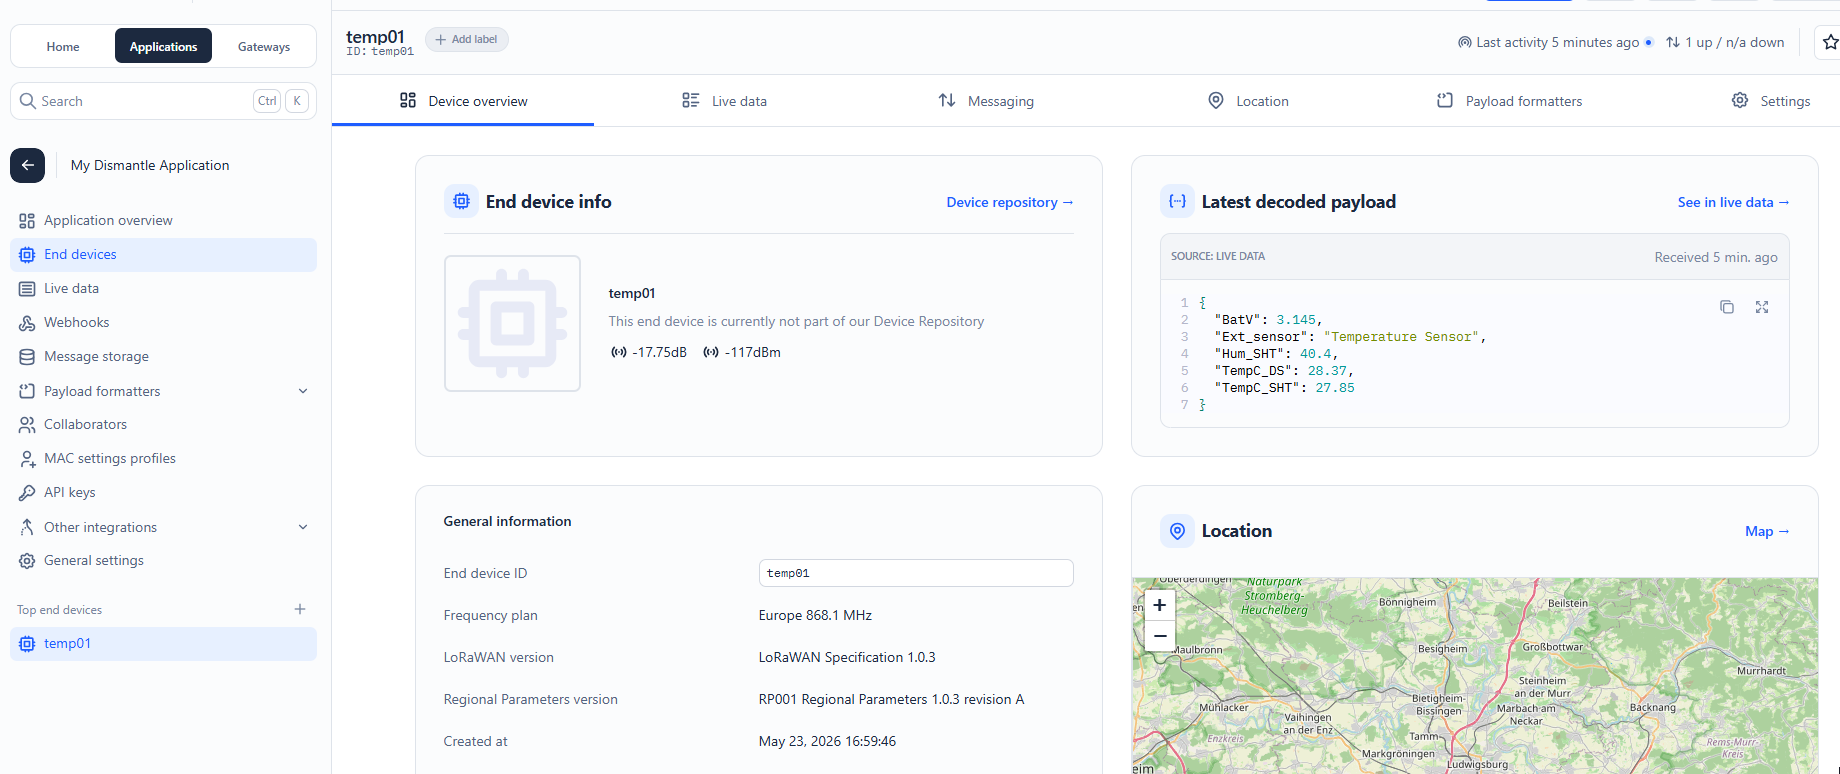
Once the Dragino LHT65SE3 is registered as an end device on The Things Network, the device overview page in the TTN console is the first place we go to verify that everything is healthy. A correctly added device shows a green “last seen” indicator, basic info like the EUIs and the chosen frequency plan, and most importantly a “Latest decoded payload” block on the right that contains real values. In our case we already see temperature and humidity readings coming in, which means the radio side of the chain is doing its job.
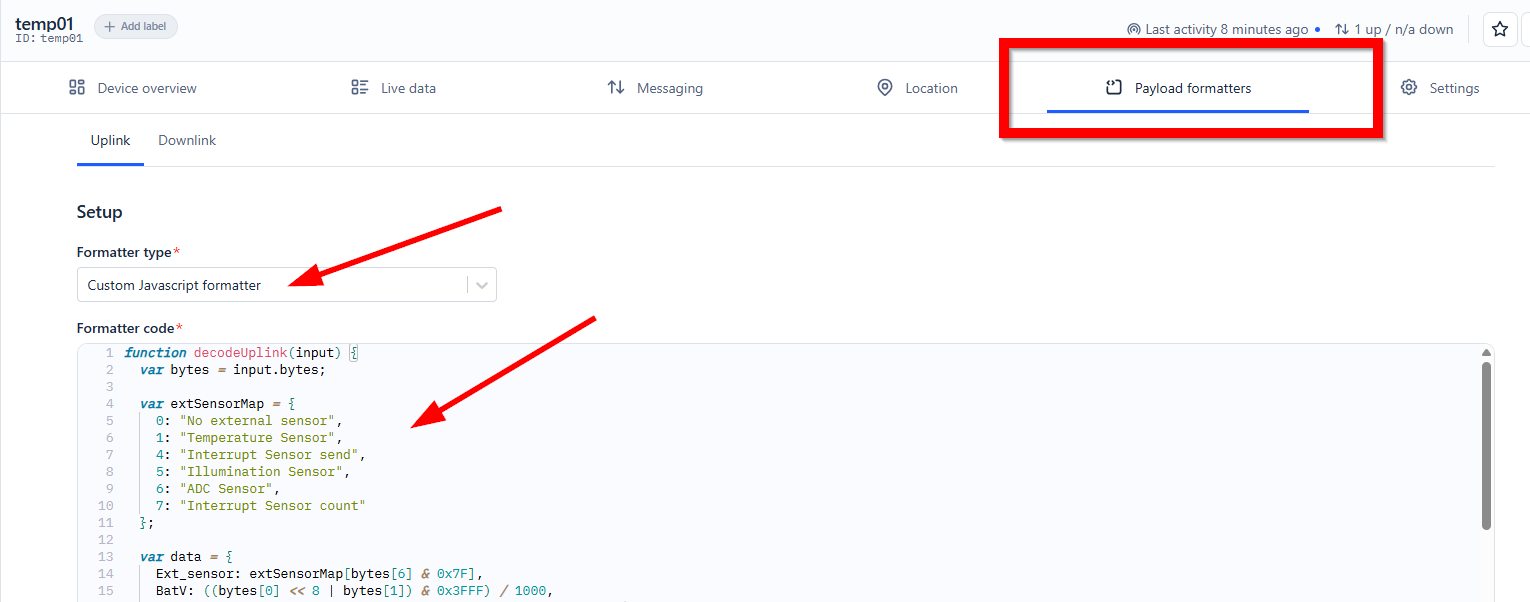
There is one important piece that does not happen automatically: TTN receives the uplink as a sequence of raw hex bytes, and somebody has to tell it how to interpret those bytes as temperature, humidity, battery voltage and so on. That somebody is the payload formatter. For Dragino devices, we do not need to write our own. Dragino publishes ready-to-use JavaScript decoders for every product on their website, so we just copy the snippet for the LHT65SE3, head into the device’s “Payload formatters” tab in TTN, switch the formatter type to “Custom Javascript formatter”, and paste the code in. The screenshot below shows the formatter in place, with the start of the decodeUplink function and the sensor type map that turns the bytes into the friendly field names we will later read from Peakboard.
From this point on, every uplink that arrives at TTN is automatically decoded into a clean JSON object, which is exactly the format we want before we leave the TTN side of the world and switch over to Peakboard.
Pulling the data into Peakboard via REST
There are two fundamentally different ways to bring TTN data into a Peakboard application, and we will walk through the simpler one first: a plain REST call against the TTN storage API. The advantage of this approach is that it works on demand. Peakboard asks, TTN answers, and we are done. The downside is that we only ever see the most recent stored message at the time of the request, not a live stream.
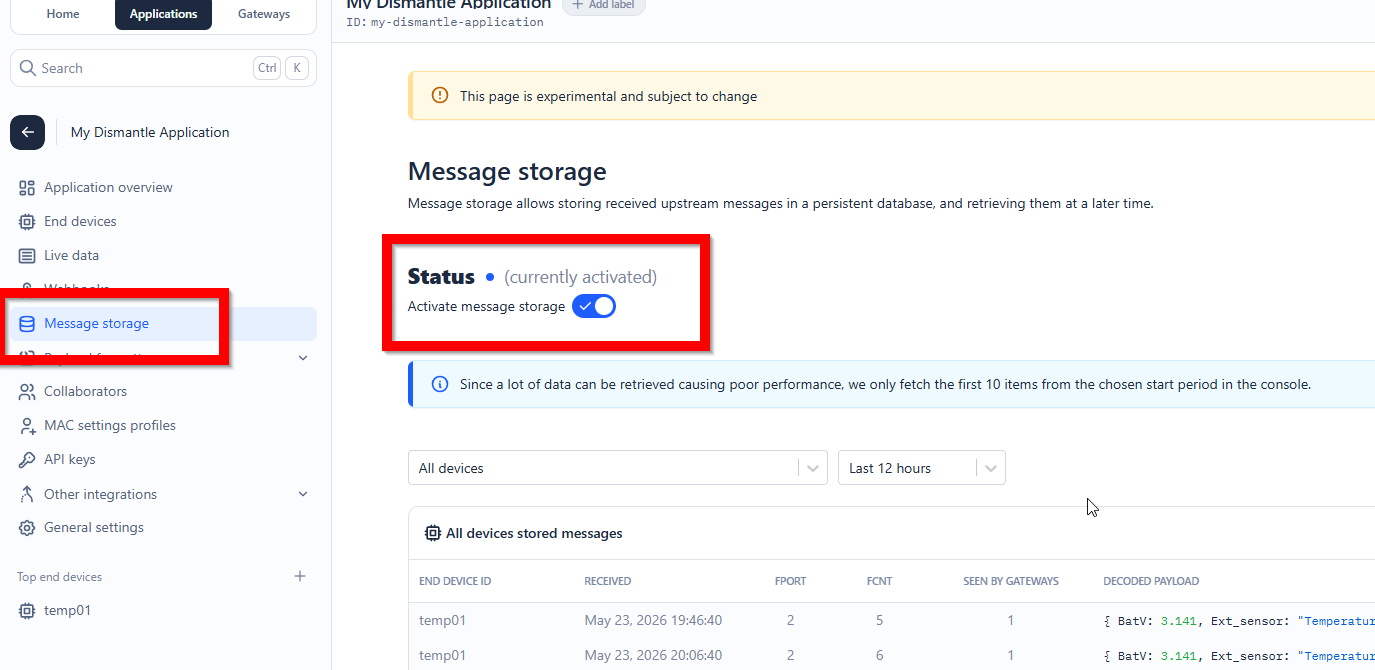
Before we can query anything, we have to tell TTN that we actually want it to remember the uplinks. Out of the box, TTN happily routes incoming messages but does not persist them. We go into the application settings, open “Message storage”, and flip the “Activate message storage” toggle to on. From that moment on every uplink lands in a persistent database that we can query later. The screenshot below shows the toggle in its enabled state, with a few stored messages already visible at the bottom of the page.
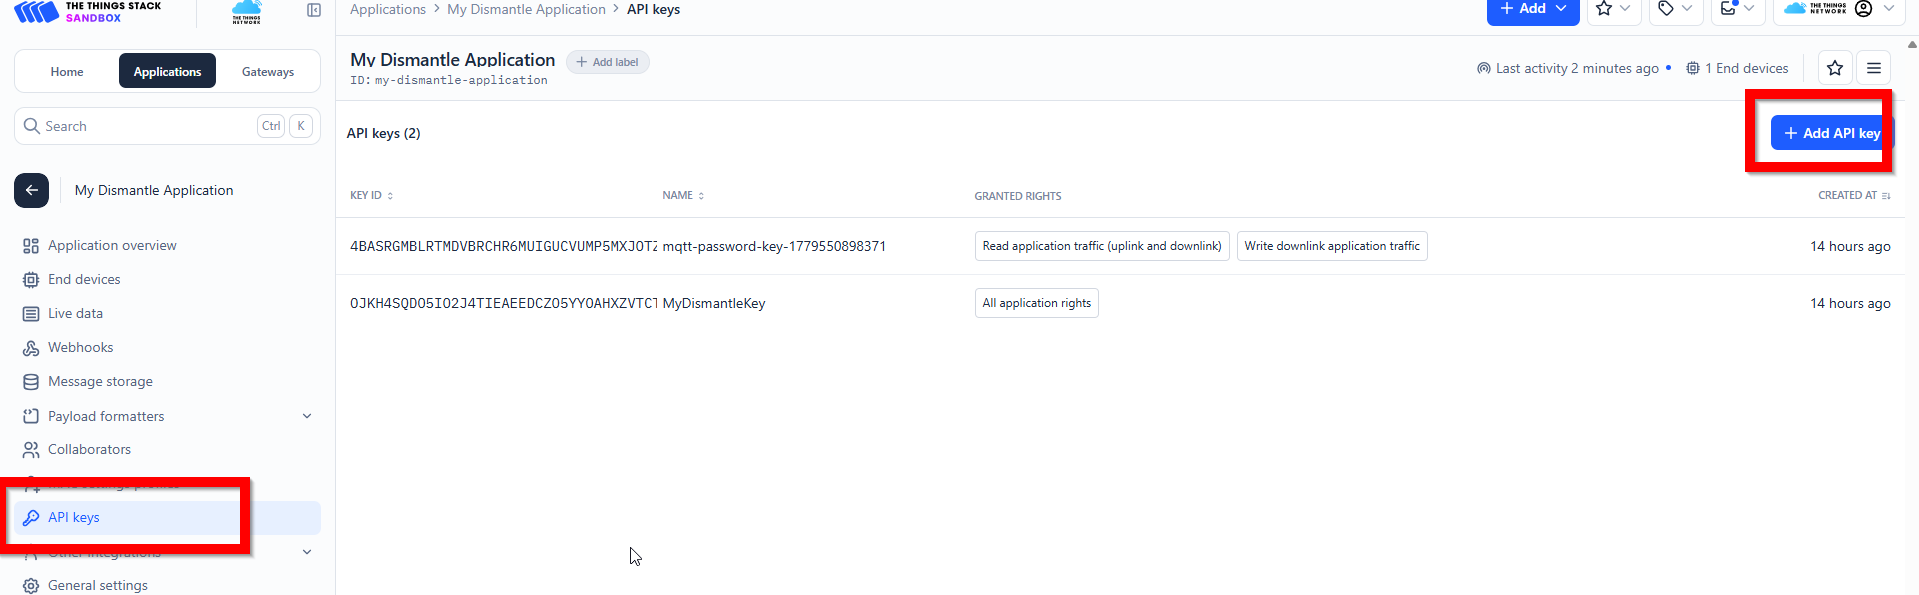
The second prerequisite is an API key. TTN protects the storage API with bearer tokens, so we head into “API keys” in the same application, click “Add API key”, and create one with read access to the application traffic. We copy the token somewhere safe immediately, because TTN only shows it once.
With message storage on and the API key in hand, the actual call is a simple HTTPS GET against:
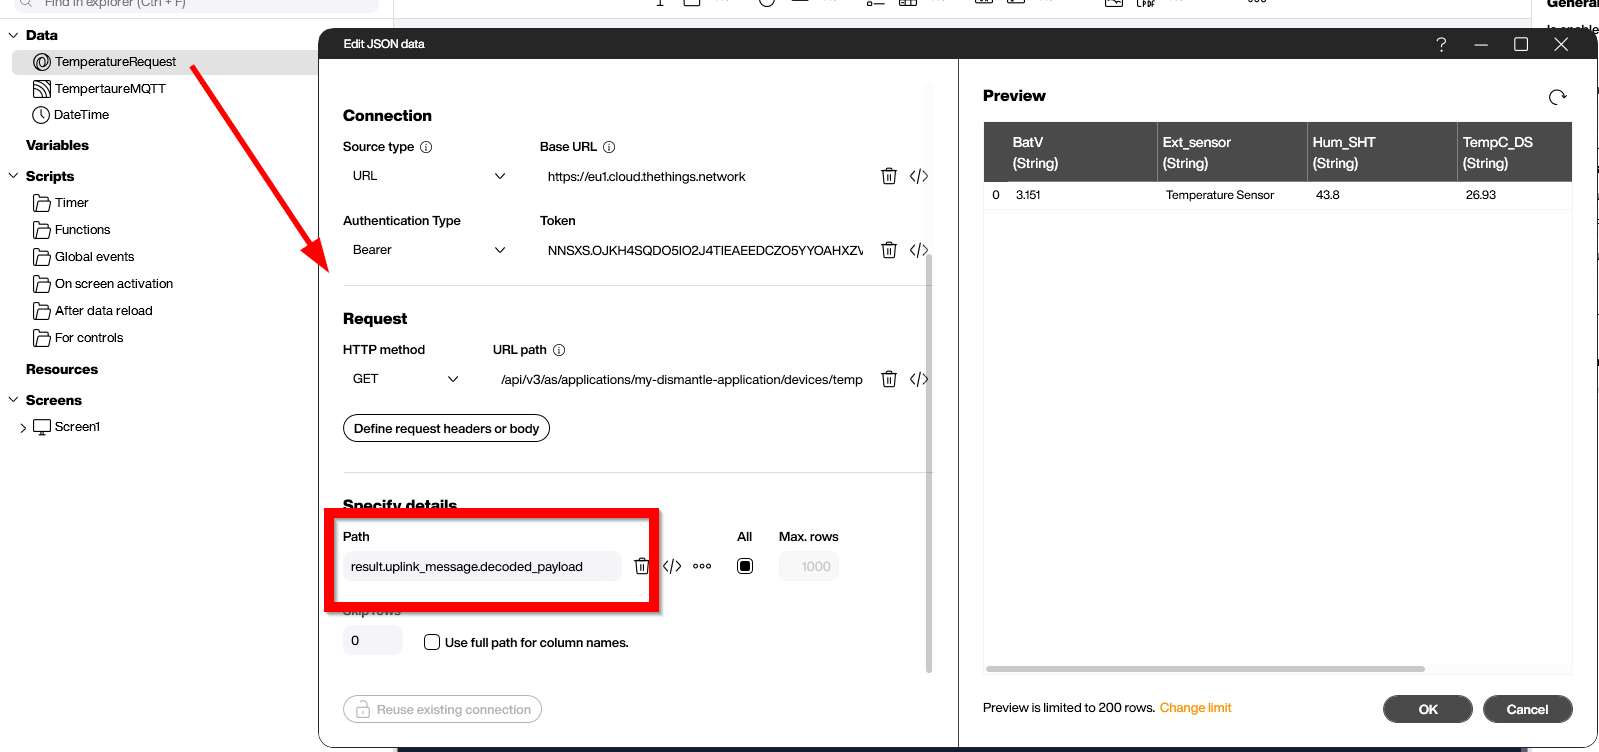
https://eu1.cloud.thethings.network/api/v3/as/applications/my-dismantle-application/devices/temp01/packages/storage/uplink_message?limit=1&order=-received_atThe limit=1 and order=-received_at query parameters make sure we only get the single most recent uplink instead of the whole history. In Peakboard we set this up as a regular URL/JSON data source: base URL https://eu1.cloud.thethings.network, the path above, GET, and the authentication type set to Bearer with the API key we just created. The interesting bit is the JSON path: we point Peakboard at result.uplink_message.decoded_payload, which is exactly where the formatter we configured earlier writes the friendly field names. The preview on the right confirms that we get back a tidy little table with BatV, Ext_sensor, Hum_SHT and TempC_DS columns, ready to be bound to any control on a screen.
This is more than enough for dashboards that refresh once every few minutes. If we want to react to a fresh value the very moment the sensor sends it, however, we need a different mechanism, which is exactly what we look at in the next section.
Trigger-based access via MQTT
The REST approach is pull-based. We ask, TTN answers, and the application has no idea that anything happened in between two requests. The second integration option is push-based and built right into TTN: every application on TTN automatically exposes an MQTT endpoint, and any decoded uplink is published there the moment it arrives at the network server. If we want a screen that lights up the instant a sensor sends a new value, this is the route to take.
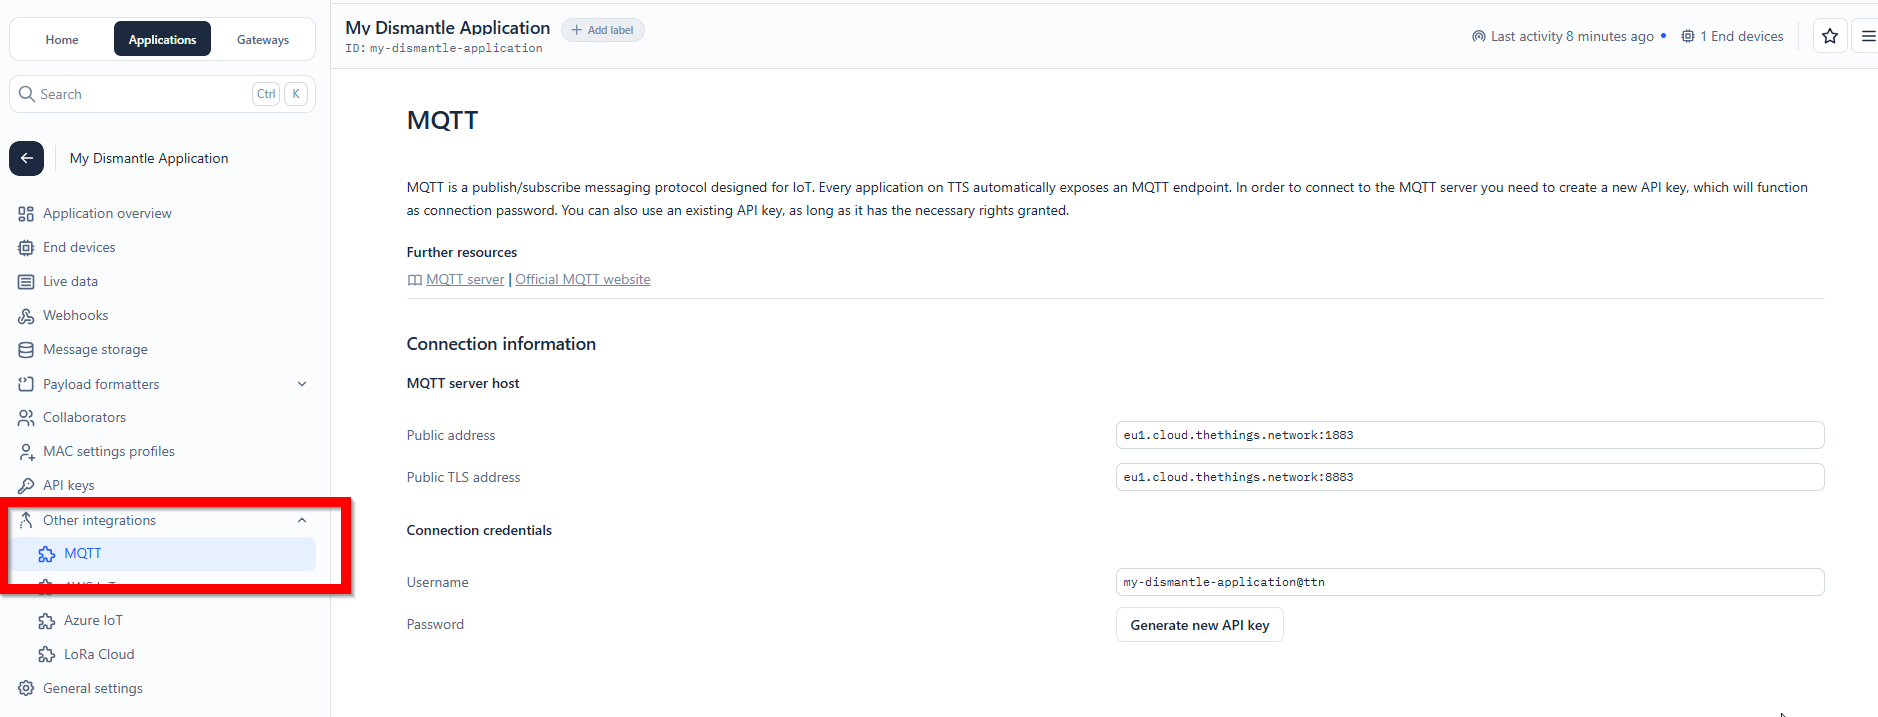
The connection details for the MQTT broker live in the same TTN console as everything else. Under “Other integrations” we open the “MQTT” page and find the server host (in our case eu1.cloud.thethings.network on port 1883, or 8883 for TLS), the username, which is the application ID with @ttn appended, and a password field. The password is not a separate concept here, it is just another API key. We click “Generate new API key” right next to the password field, copy the token immediately, and we have a full set of MQTT credentials.
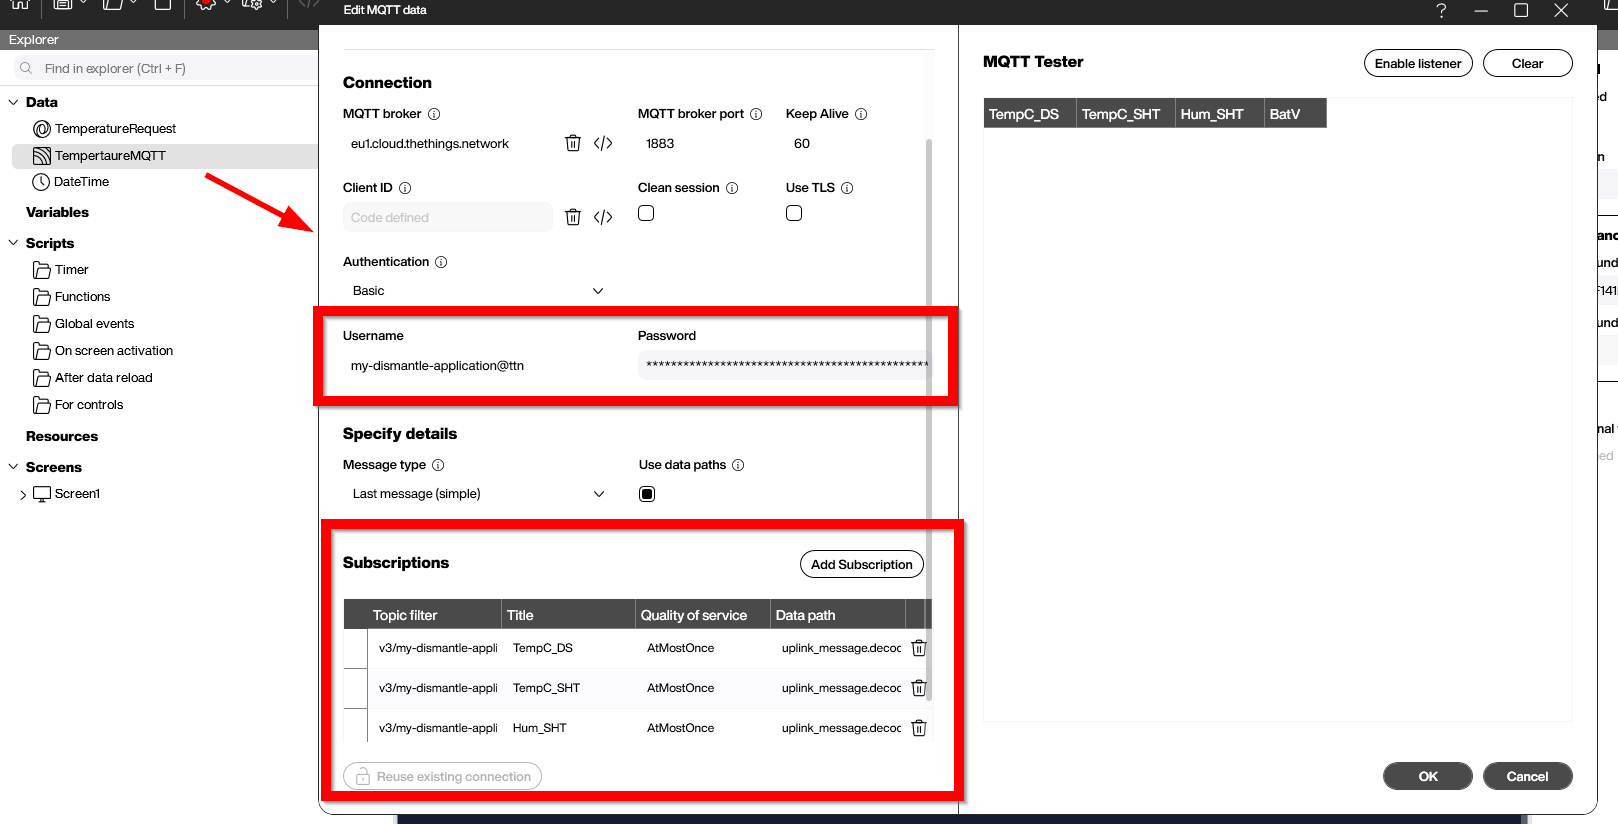
On the Peakboard side we add a new MQTT data source and feed it those exact connection parameters: broker eu1.cloud.thethings.network, port 1883, basic authentication with the my-dismantle-application@ttn username and the freshly generated API key as the password. The topic we want to subscribe to is the per-device uplink stream:
v3/my-dismantle-application@ttn/devices/temp01/upEvery uplink arrives on this topic as a JSON document, with the actual sensor readings tucked away under uplink_message.decoded_payload (the same shape we already saw via REST). Rather than pulling the whole document into memory and parsing it in script, we let Peakboard do the work by enabling the “Use data paths” option and listing one subscription entry per field we care about. In our example we add three entries, all pointing at the same topic, with data paths uplink_message.decoded_payload.TempC_DS, uplink_message.decoded_payload.TempC_SHT and uplink_message.decoded_payload.Hum_SHT. Each becomes a column in the resulting list, and the MQTT tester on the right confirms that the values show up in real time as soon as the sensor sends them.
From here on, anything we can do with a regular Peakboard data source is on the table: bind the values to gauges and tiles, trigger a script when a new message arrives, or push the readings into a Peakboard Hub list for historical analysis. The latency between the sensor sending a value and the screen reflecting it is essentially network speed.
The result side by side
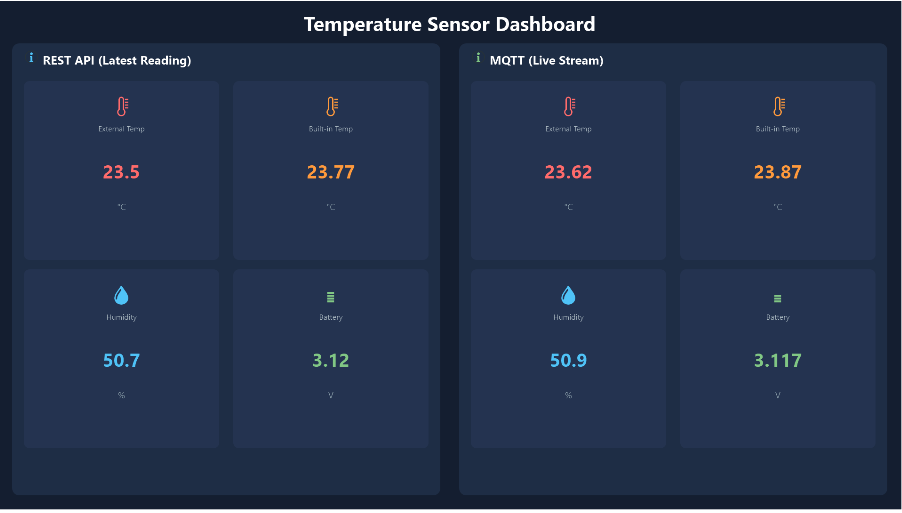
To make the difference between the two integration styles tangible, our demo application puts them right next to each other on a single screen. On the left we have a “REST API (Latest Reading)” panel that is fed by the JSON data source from the storage API, and on the right we have an “MQTT (Live Stream)” panel that is fed by the MQTT subscription. Both panels show the same four readings: external temperature, built-in temperature, humidity and battery voltage. The values are almost identical, but the MQTT side updates the instant a new uplink arrives, while the REST side refreshes on its own schedule.
The complete sample, including both data sources, the screen layout and the bindings, is available as LoranTemperatureSensor.pbmx at the top of the article. Drop in our own TTN application ID, device ID and API keys, and we are good to go.