Graph API offers a ton of monitoring reports that give system admins insights into their Office 365 tenant. Please find the official documentation here. In today’s article, we will take a look at a report that lists the aggregated Outlook activity per day, for an entire organisation. Here’s the relevant documentation.
Please make sure to read through the basics of using MS Graph API in Peakboard: MS Graph API - Understand the basis and get started
Configuring the data source
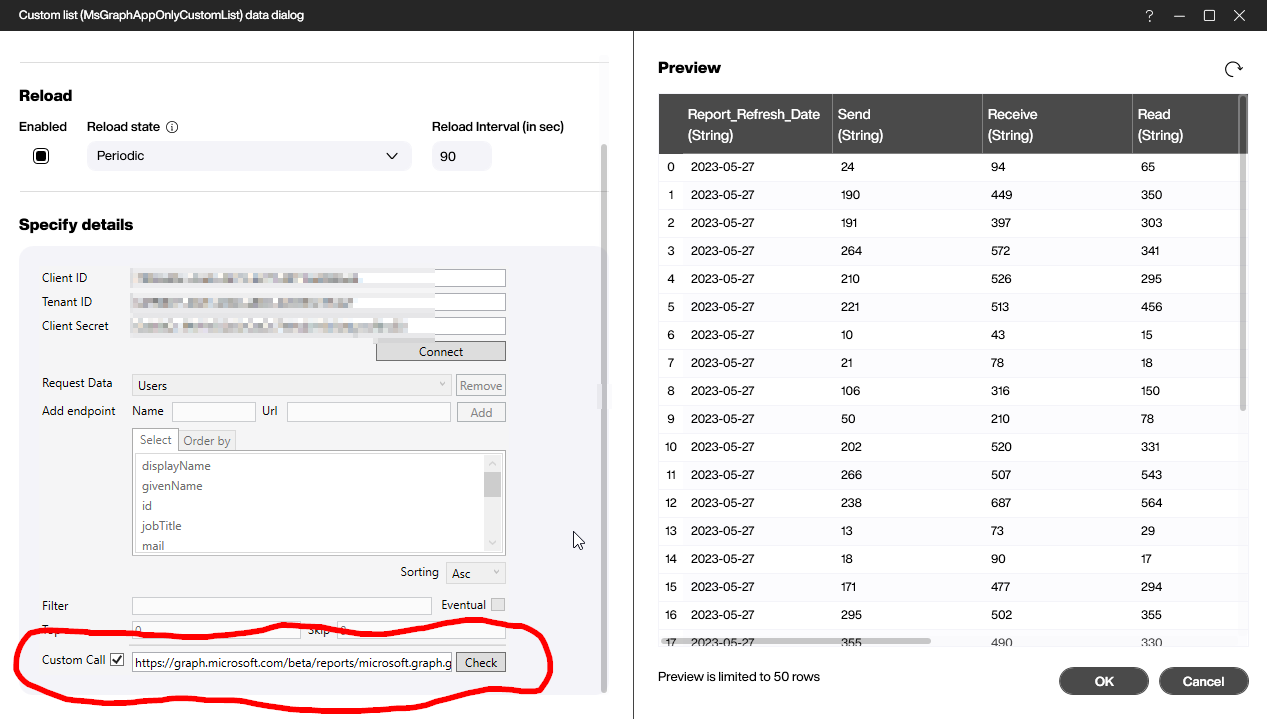
The correct URL for the report is:
https://graph.microsoft.com/beta/reports/microsoft.graph.getEmailActivityCounts(period='D30')We provide an additional parameter, period='D30', to indicate that we only want the data from the last 30 days. For the data source, we use a App-only Graph extension list that doesn’t require any user delegation. Depending on how you configured your AD-registered app, please make sure to have granted the permission for Reports.Read.All there.
Getting the data ready
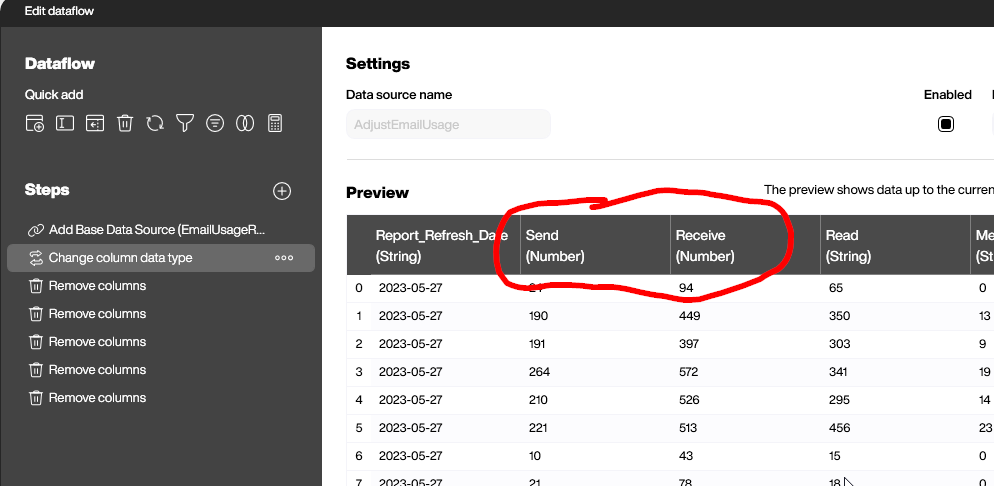
All the data comes as string data types, so it’s hard to to use it in a chart later. We need to add a data flow below the data source, to adjust the columns for later use.
We convert the two columns Send and Receive into numbers.
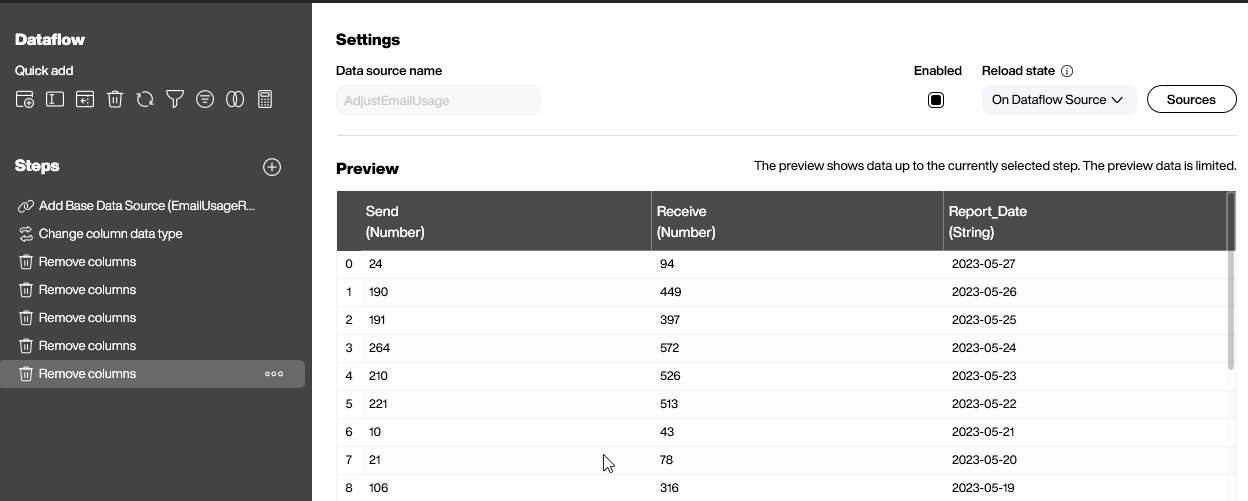
And we remove all the useless columns, except for the data and the two numbers we’re interested in. That’s it.
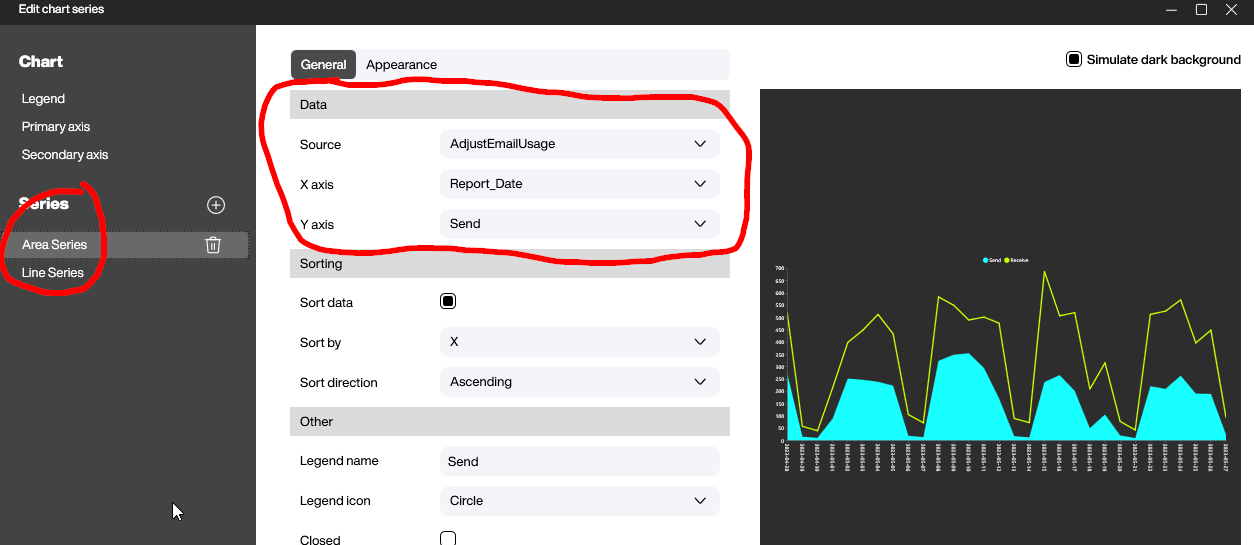
Building the chart
A line and area chart is a good choice to display the data. In this case, we use two series. One for the received emails, and one for the sent emails. The x-axis is always the date. The configuration is straightforward, as we already prepared the data very well.
Let’s go ahead and have a look at the final result:
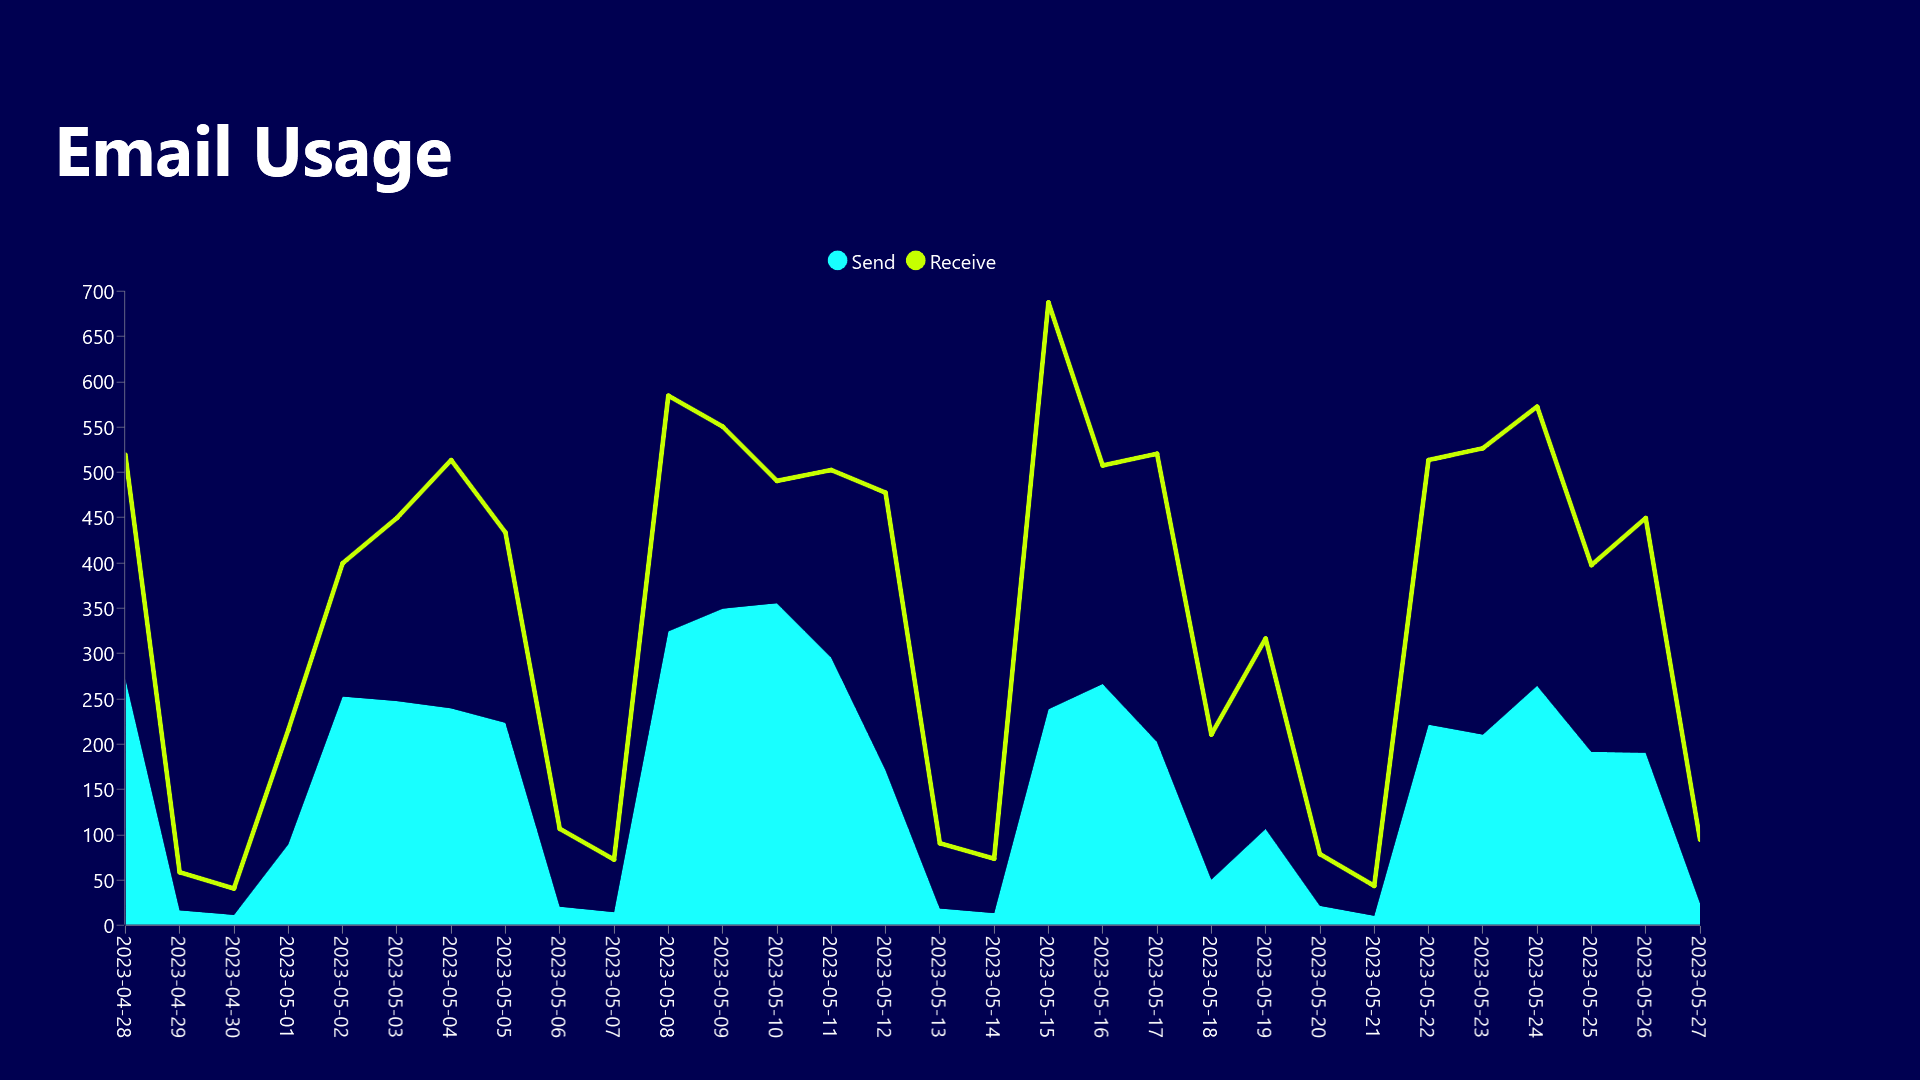
- Download GraphEmailUsageReport.pbmx