InfluxDB is a time-series database. Unlike general-purpose databases like MySQL, InfluxDB is designed specifically to deal with timestamped data—and it can scale to handle large volumes of data. It was created by InfluxData, a company based in the Bay Area.
In this article, we’ll explain how to build a Peakboard app that reads from and writes to an InfluxDB database.
Set up InfluxDB
Create an InfluxDB container
The easiest way to get started with InfluxDB is by using the official InfluxDB Docker image. The following command spins up a container in under a minute and persists its data in a Docker volume.
docker run -d
  --name influxdb
  -p 8086:8086
  -v influxdb_data:/var/lib/influxdb2
  -e DOCKER_INFLUXDB_INIT_MODE=setup
  -e DOCKER_INFLUXDB_INIT_USERNAME=admin
  -e DOCKER_INFLUXDB_INIT_PASSWORD=supersecret
  influxdb:2
Once the container is running, InfluxDB listens on port 8086.
Set up the database
To set up the database, go to http://localhost:8086/, in a web browser.
Then, create an organization.
Then, create a bucket to store data in:
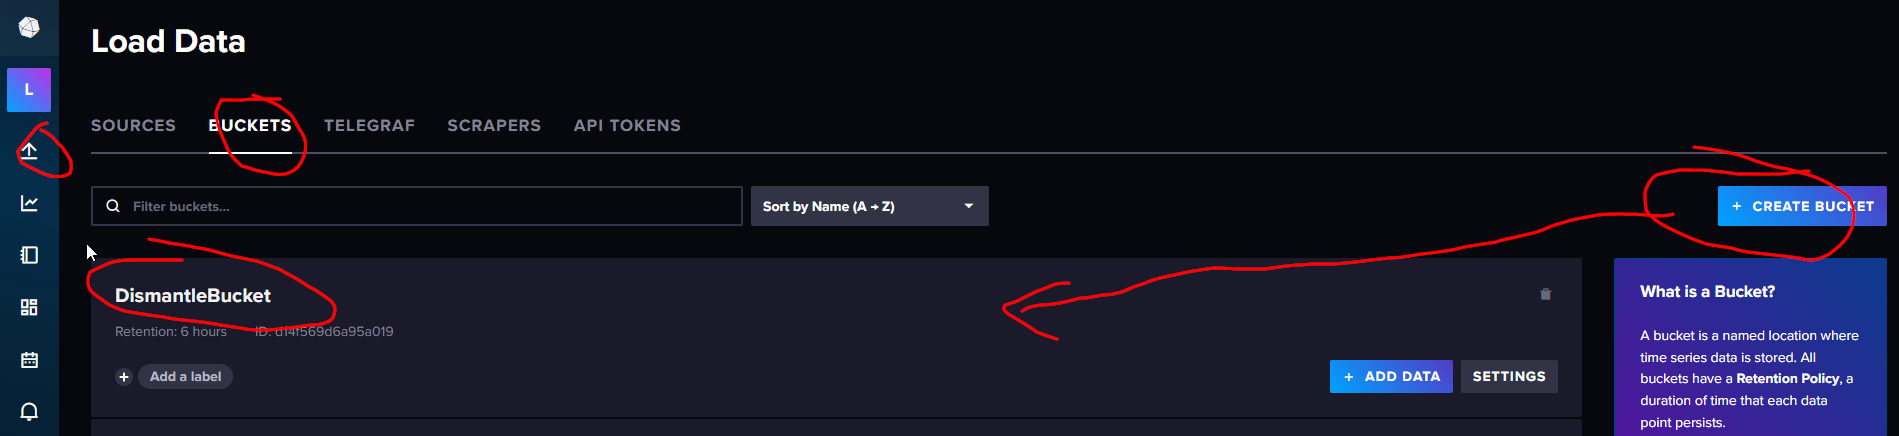
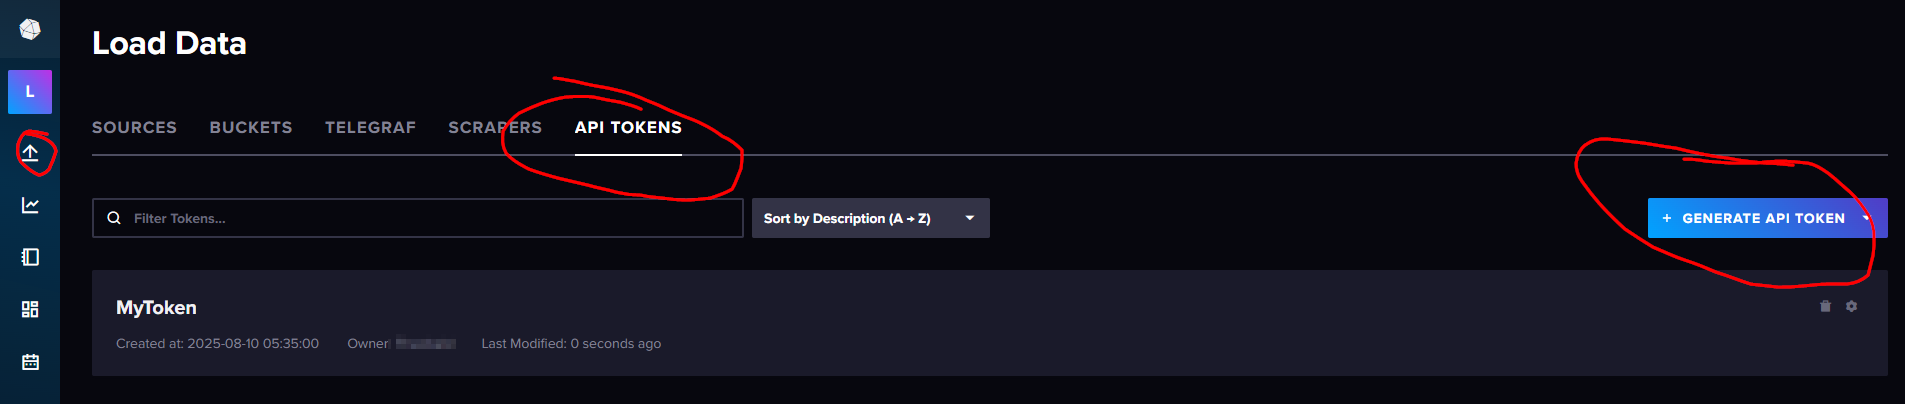
Next, click the API TOKENS tab and generate a new API token for external reads and writes.
Now, you can write data to your InfluxDB database.
Write data
InfluxDB exposes an HTTP API for reads and writes. To insert data, we use the api/v2/write endpoint:
POST /api/v2/write?org=LosPollosHermanos&bucket=DismantleBucket&precision=s
The query parameters tell InfluxDB where to store our data:
| Parameter | Description |
|---|---|
org |
The organization to store the data in. |
bucket |
The bucket to store the data in. |
precision |
The precision of the timestamp (s means seconds). |
The request body contains the data we want to store. It uses InfluxDB’s line protocol.
The following is an example request body that follows the line protocol:
temperature,sensor=lab value=26.3- The measurement is
temperature. - The sensor is called
lab. - The temperature value is
26.3.
In our Peakboard app, the user enters the temperature value they want to store:
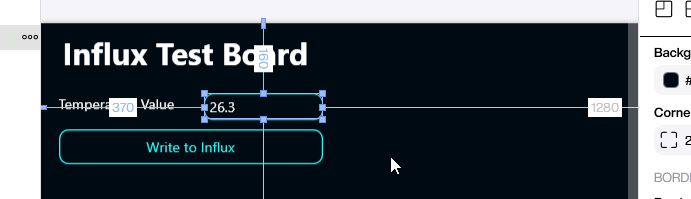
Here are the Building Blocks behind the submit button:
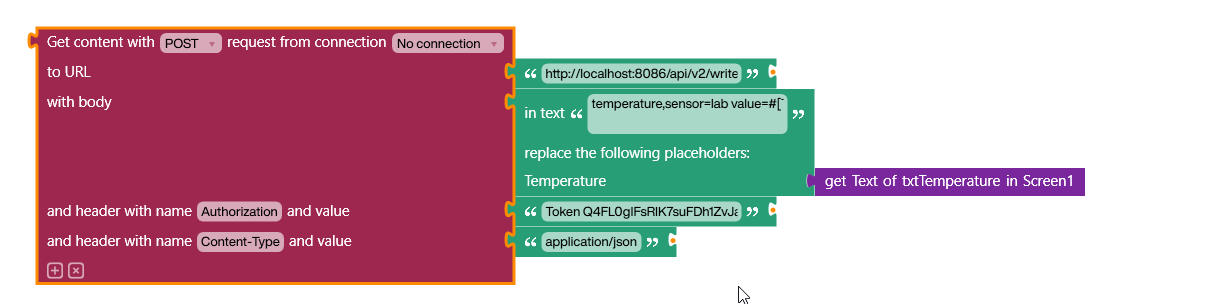
We use a placeholder in the request body and replace it with the user’s actual value. We also add two headers:
Content-Type, which is set totext/plainAuthorization, which is set toToken <YourInfluxAPIToken>
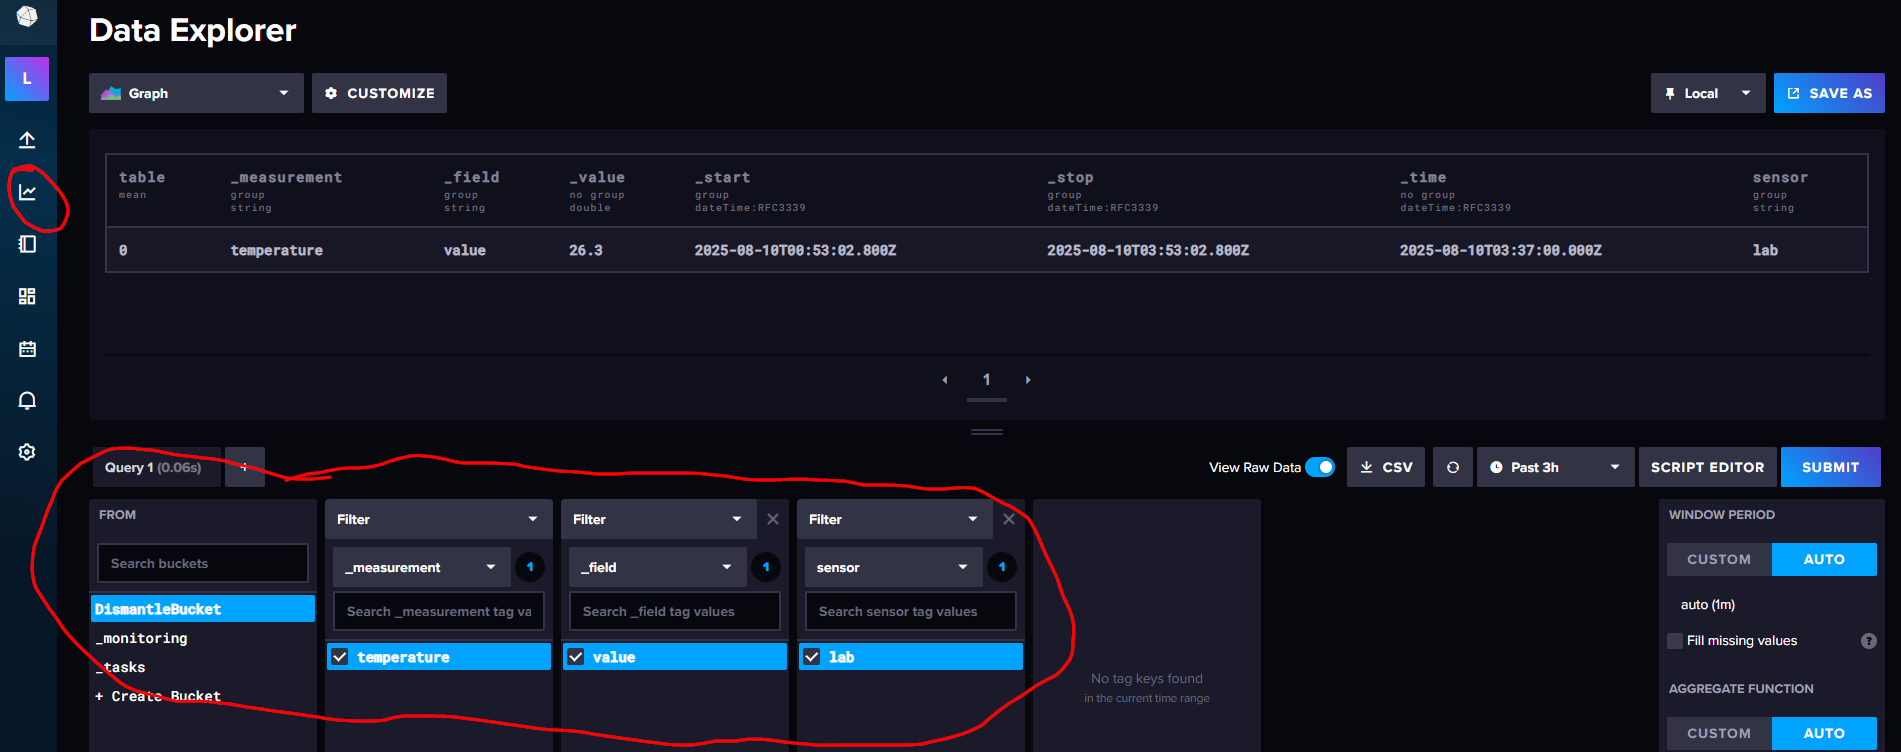
After sending the request, we can see the submitted value in the Influx Data Explorer:
Query data
To query data, we use the api/v2/query endpoint. However, this data comes in a CSV format with multiple header lines, so it requires extensive parsing. To avoid all that hassle, we use the InfluxDB extension, which handles the parsing for us.
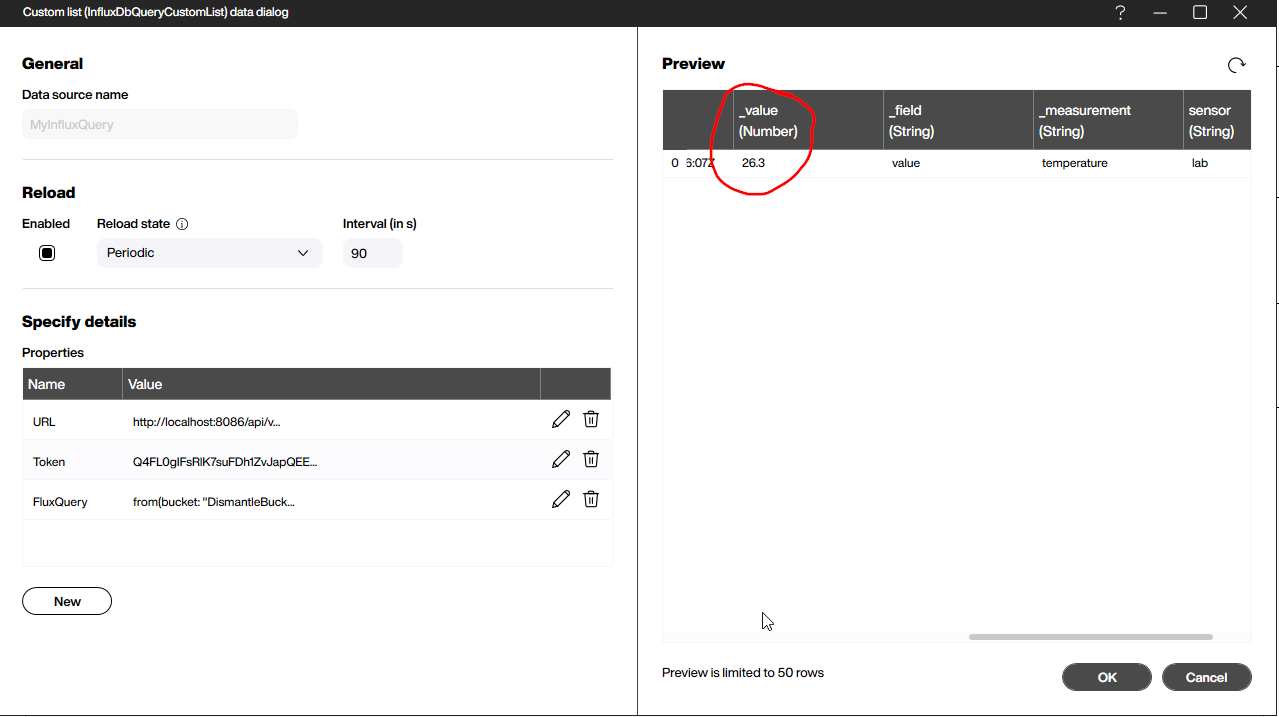
We install the InfluxDB extension. Then, we create a new InfluxDbQueryCustomList data source. We provide the following parameters:
| Parameter | Description |
|---|---|
URL |
The URL of the query API call, including the organization name. For example: http://localhost:8086/api/v2/query?org=LosPollosHermanos |
Token |
The API token that authenticates us. |
FluxQuery |
The query string that specifies the data we want. |
The following is our example query:
from(bucket: "DismantleBucket")
  |> range(start: -2h)
  |> filter(fn: (r) => r._measurement == "temperature")
  |> filter(fn: (r) => r._field == "value")
  |> max()
It does the following:
- Read from
DismantleBucket. - Limit the range to the last two hours.
- Filter for the
temperaturemeasurement. - Filter for the
valuefield. - Return the maximum value in that window.
The following screenshot shows the response to our query. There are two timestamps for the start and end of the query period. And the actual value appears in the _value column. Our example outputs a single row—but additional fields or sensors would produce multiple rows.
Result
You just saw how easy it is to write to and read from InfluxDB with Peakboard. InfluxDB scales to massive sizes and is simple to use, but it’s best reserved for time-based measurements. Data without timestamps is better suited for other types of databases.