
We recently gave an introduction of Peakboard Hub Flows. In that article, we explained the basics of how to build, deploy, and monitor Peakboard Hub Flows. In this article, we take Hub Flows one step further and showcase a real-world scenario where Hub Flows are very helpful.
The scenario
Assume that you have a large number of Peakboard instances running inside your factory or warehouse. Each of these instances pull the same (or similar) data from your ERP system. This could be the data for loading gates (open deliveries) or other data for monitoring processes.
The key point, though, is that each of your Peakboard instances have to individually query your ERP system for the data that they need—even though all the instances need the same (or similar) data.
You don’t want a large number of Peakboard instances, potentially hundreds, to query your ERP system for the same data, every 30 or 60 seconds. This puts a heavy workload on your ERP system.
Instead, you want to query your ERP system once, and then distribute the data to all your Peakboard instances—in a hub and spoke model. That way, you reduce the workload on your ERP system down to the bare minimum.
So, you create a Hub Flow that queries your ERP system for the necessary data, and stores it in a Hub list. It repeats this process every 90 seconds, so the Hub list always stays up to date. Then, each of your Peakboard instances can get the data they need asynchronously, by pulling it from the Hub list—all without ever having to bother your ERP system.
Now that we’ve explained the motivation behind this example, let’s dive into how you actually build it.
Collect the data in SAP
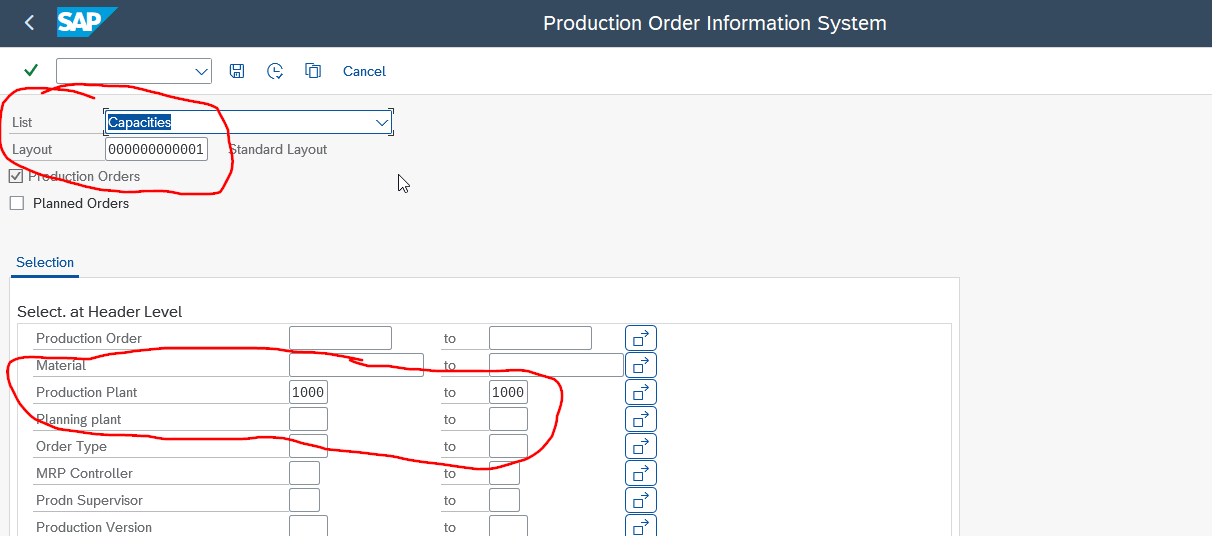
First, we need to collect the necessary data in our ERP system (SAP). For this example, lets say that we need workplace capacity data.
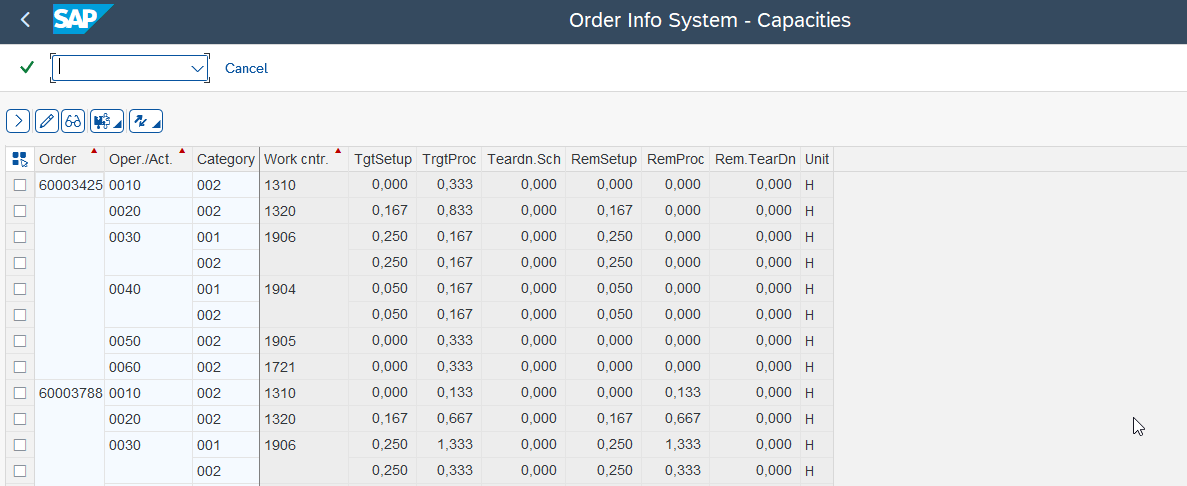
The main method for retrieving workplace capacity data is the well-known transaction COOIS. We have an article on COOIS, if you need a refresher. The following screenshots show the selection screen and the output in the SAP GUI. We store our selection (layout and plant) in a variant that we can use later.
Create the data source
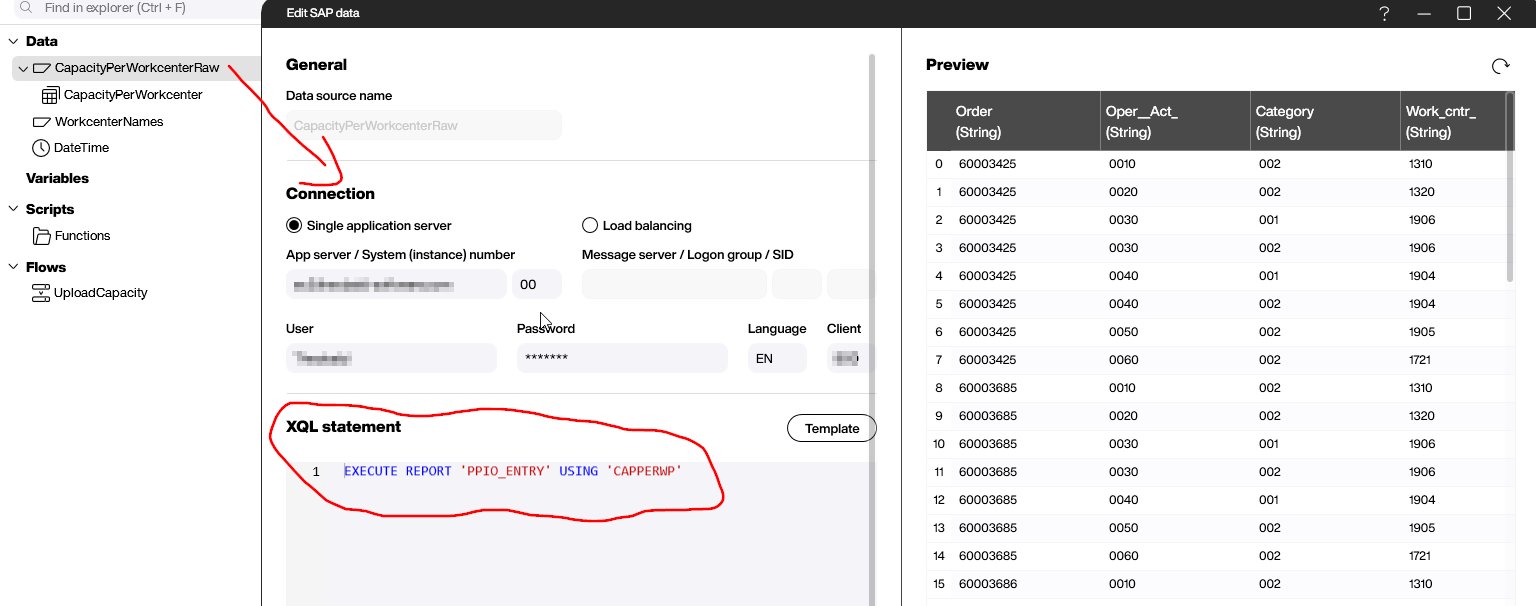
Next, we jump into Peakboard Designer and create a new Hub Flow project. We add an SAP data source, which we use to get the workplace capacity data from SAP.
We use an XQL statement to execute the report PPIO_ENTRY, with the previously saved variant:
EXECUTE REPORT 'PPIO_ENTRY' USING 'CAPPERWP'
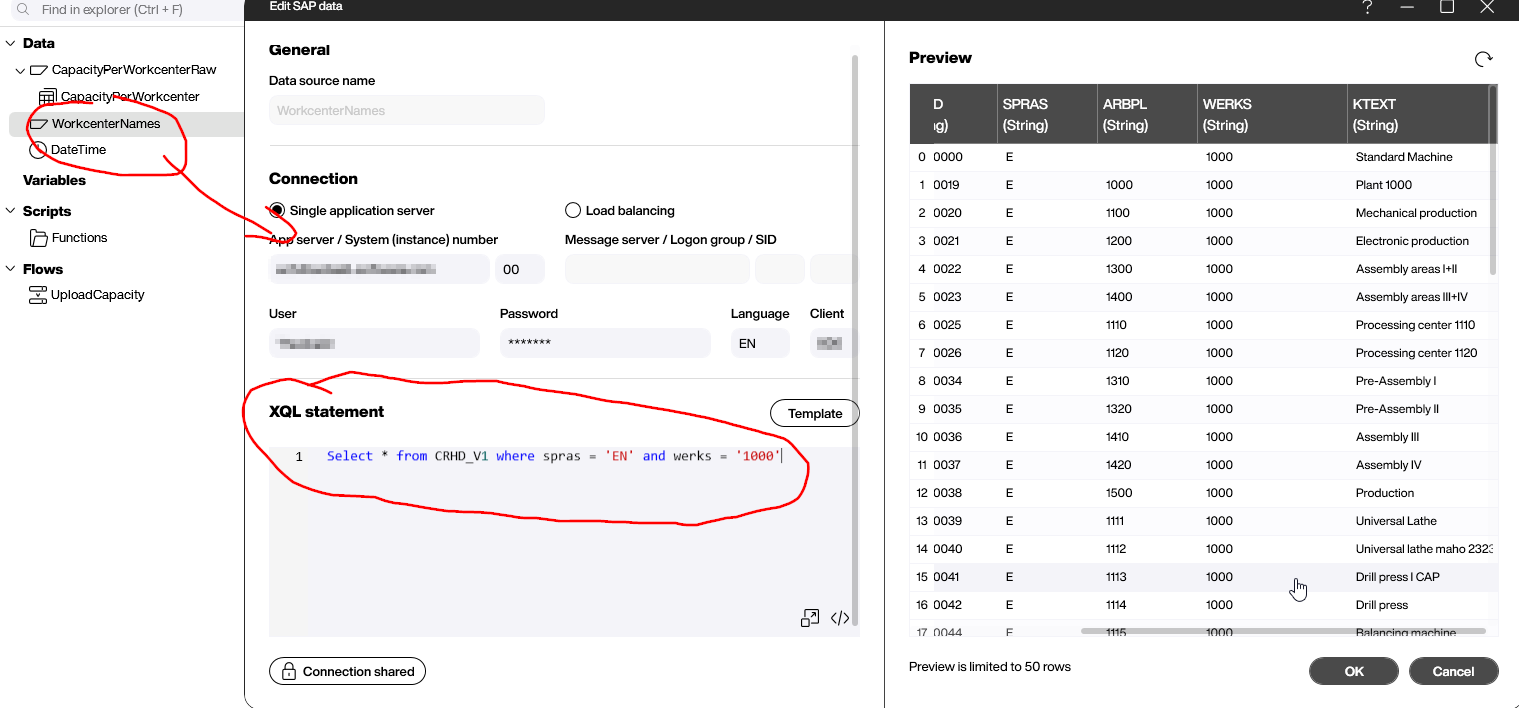
This report gives us every operation at every workplace within a given plant. However, it only gives us the workplace name. What we want is the user-friendly description. To get the description, we query the view CRHD_V1. This gives us the description texts for a given language, for each workplace name.
The next step is to join the output of the COOIS transaction with the description texts. We use a data flow to do this. The field that serves as the join key is the name of the workplace.
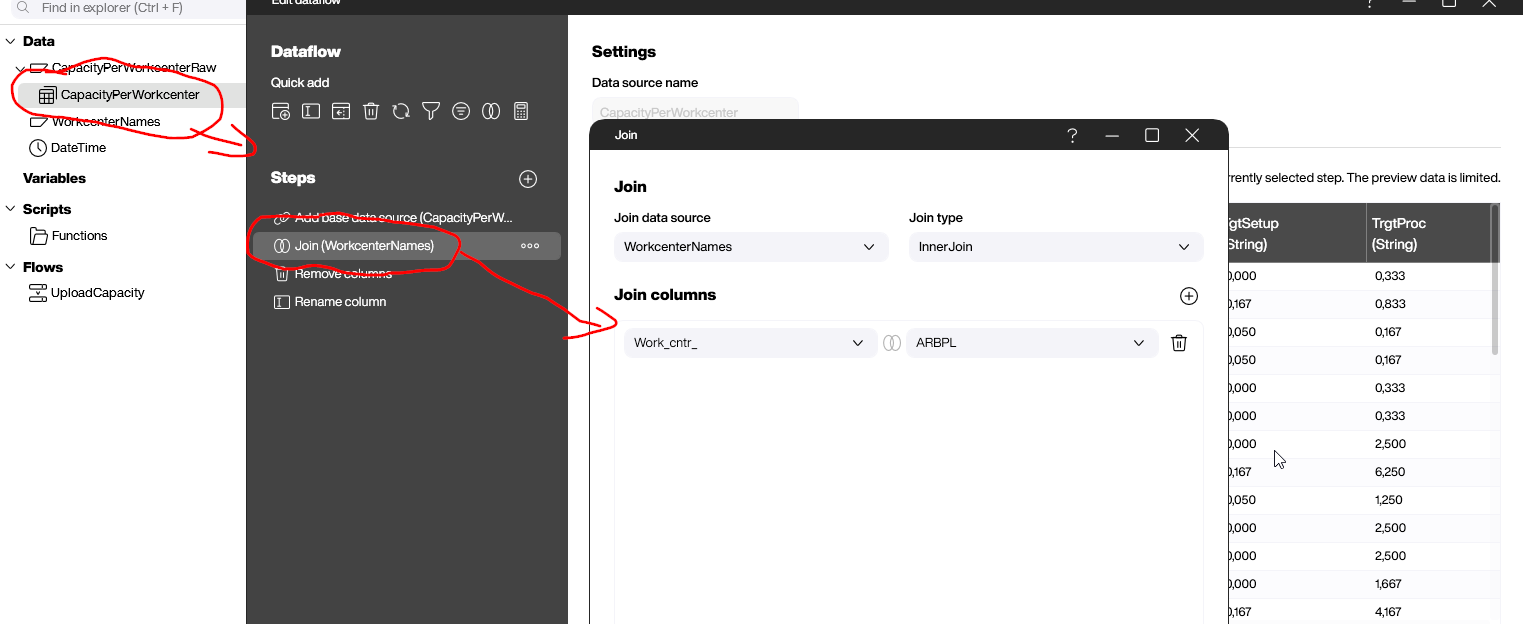
Finally, we add two more steps to the data flow:
- Remove the unused columns.
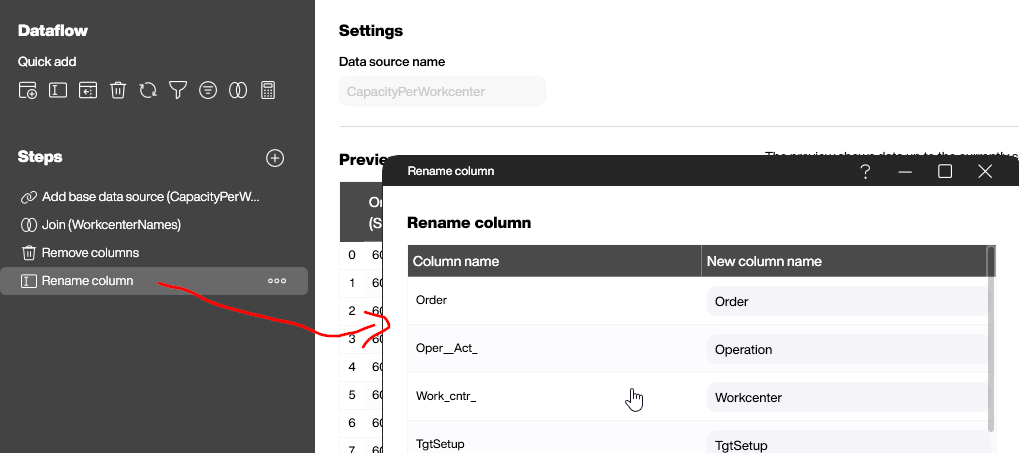
- Rename the remaining columns to make them more readable.
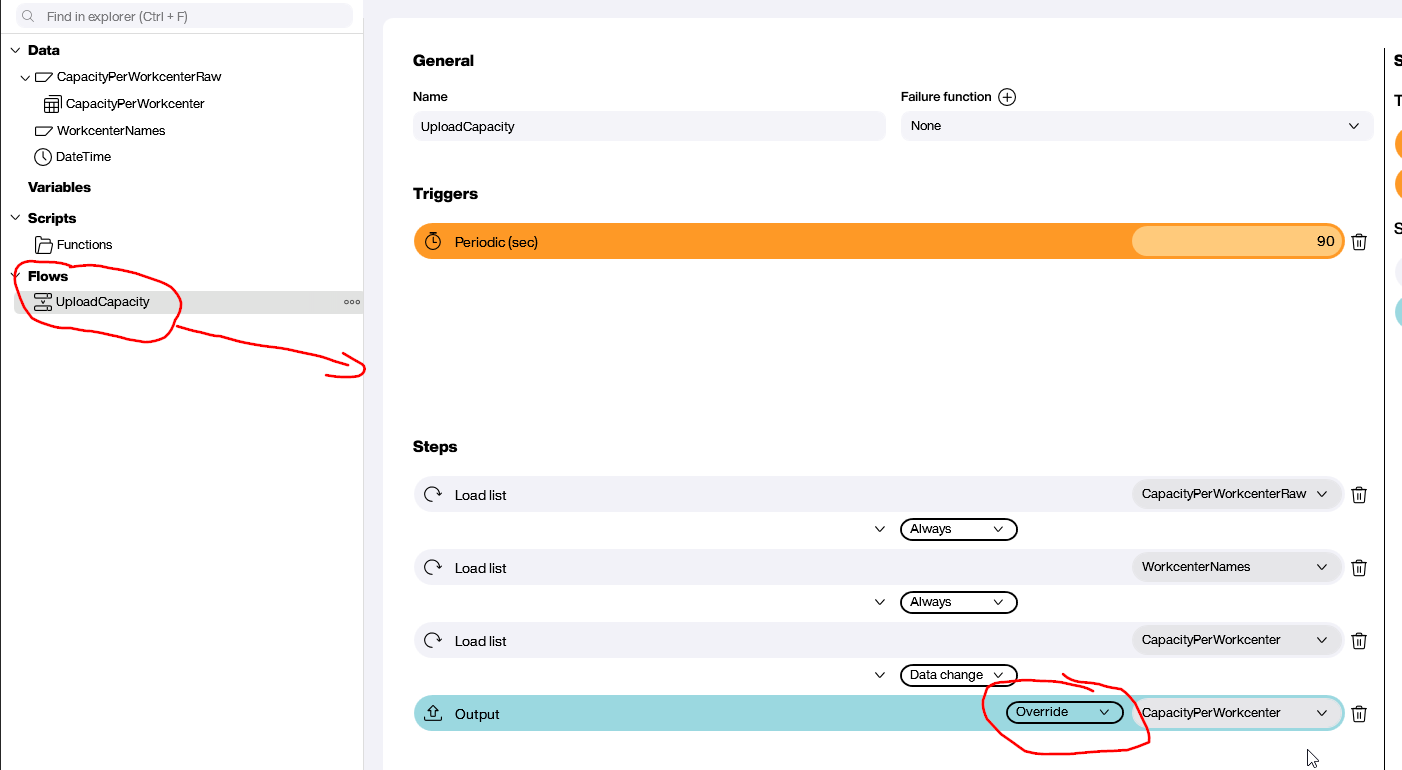
Build the Hub Flow
Now, we build the Hub Flow. The goal is to put all the data artifacts together, in the right order. The flow is triggered every 90 seconds. Here’s what happens when it’s triggered:
- Execute the data source for the capacity value.
- Execute the data source for the user-friendly descriptions.
- Execute the data flow that joins the data.
- Add the output of the previous step to an automatically created Hub list. (We explained how this works in our previous article.)
Deploy and monitor
Next, we deploy our Hub Flow. It executes automatically, every 90 seconds.
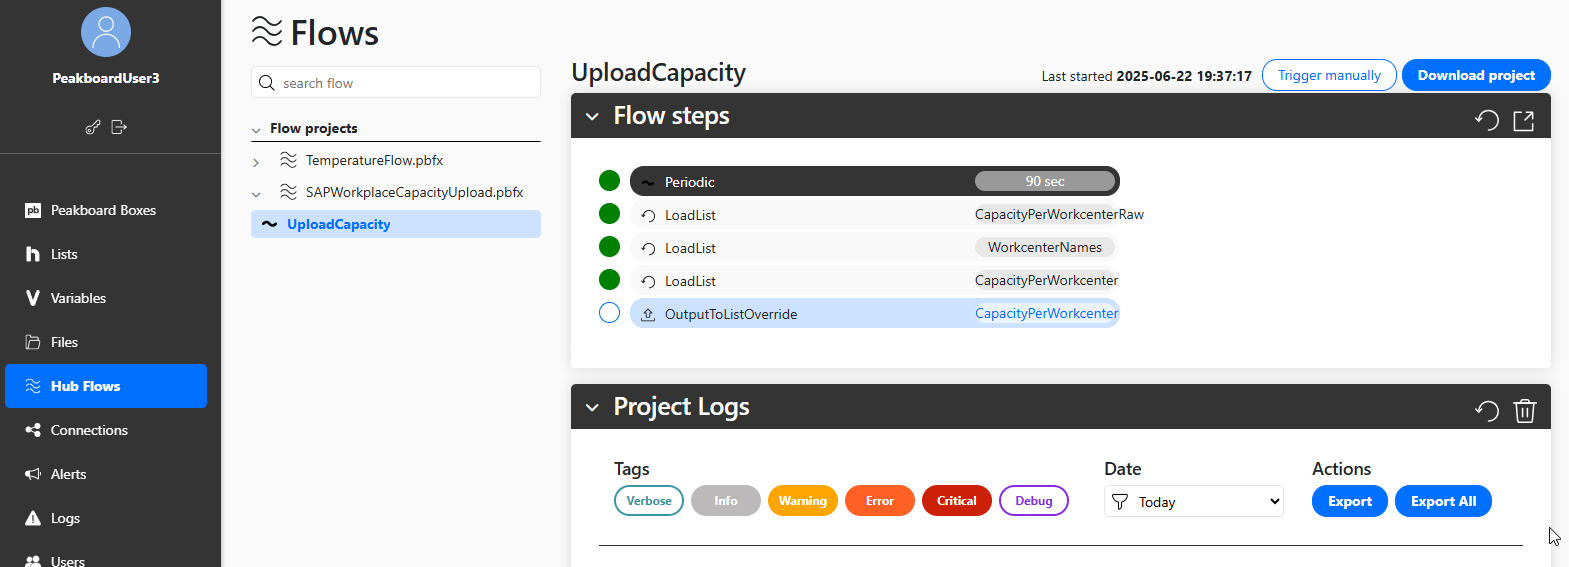
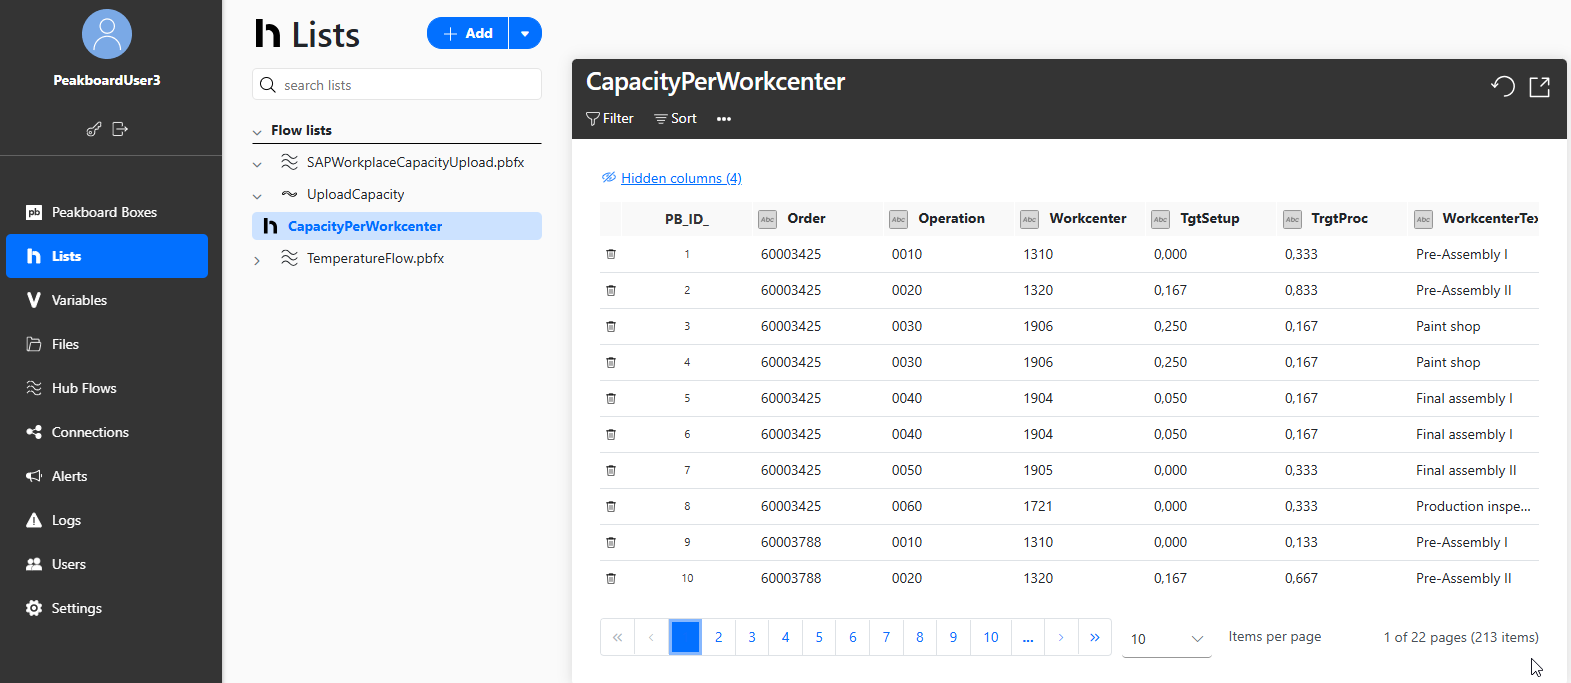
As you can see, the Hub lists stay up to date:
Consume the data
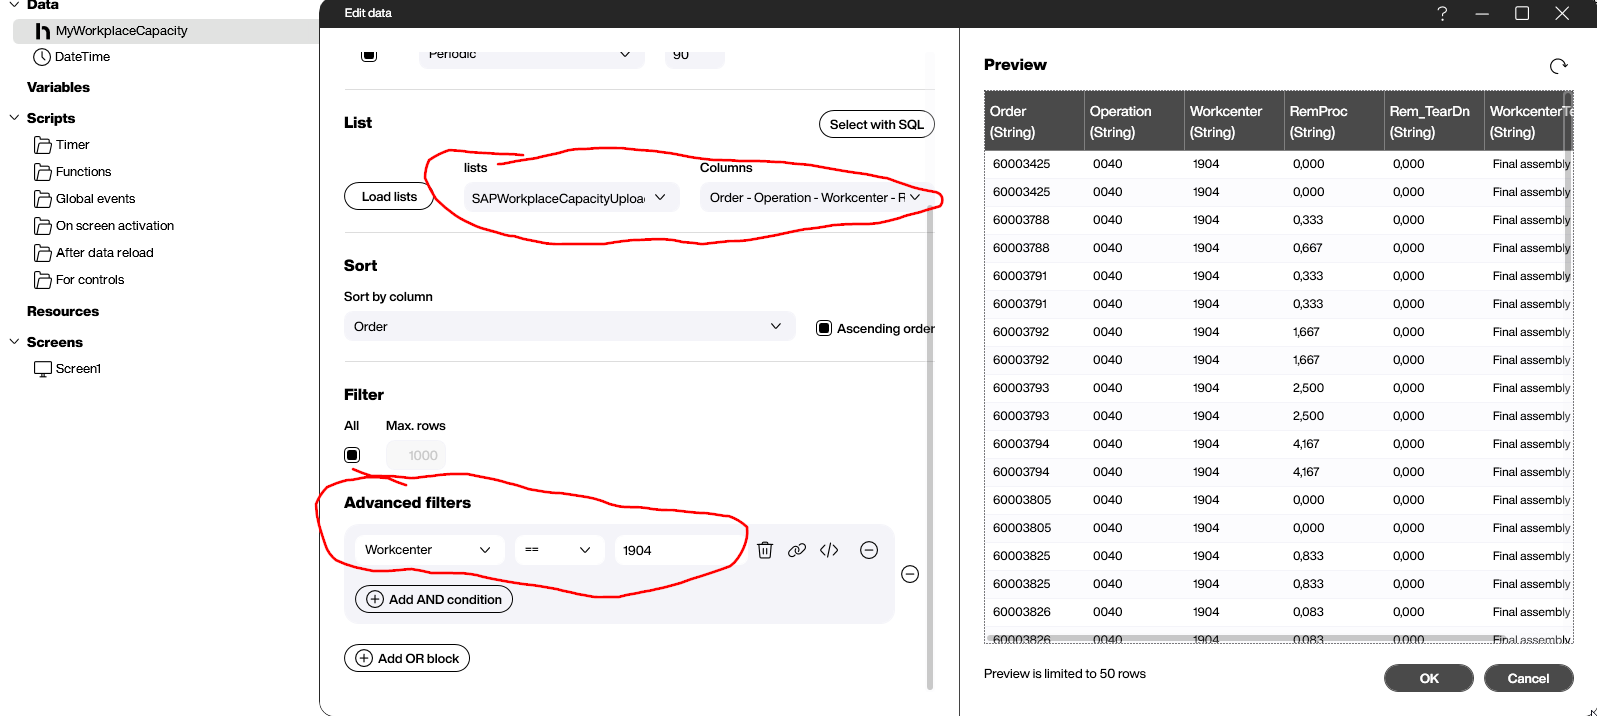
Now, a Peakboard instance in a workplace can query the data from the Hub list, and then filter it based on their workplace name:
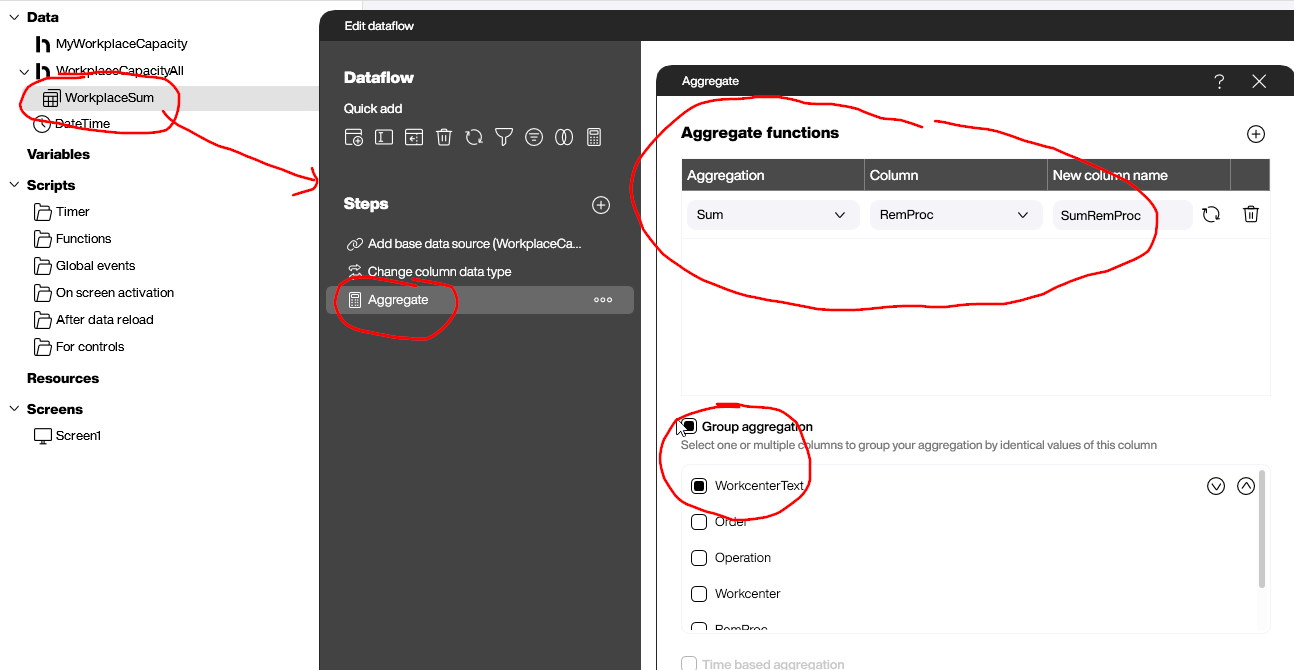
And a Peakboard instance running a plant monitoring dashboard can also query the data from the Hub list. In this case, it doesn’t want every single operation. So, it aggregates all the capacity values and groups them by workplace.
As long as the raw data is refreshed on a regular basis, all kinds of clients can consume and process it. That’s the core idea behind what we’ve built.
Result and conclusion
In this article, we explained how to use a hub and spoke architecture to distribute data from an ERP system to a large number of Peakboard instances. You should always consider this approach, when you have a source system that is especially sensitive to repetitive workloads (like SAP).