Besides Google Analytics, Matomo is the gold standard when it comes to tracking and analyzing visitor behavior on a website. This article provides a short introduction to the Matomo Reporting API. This API provides access to the analytics data through different layers of aggregation.
The best way to access these data is by using the XML data source in Peakboard. So we will covers some basics around this as well.
Matomo backend
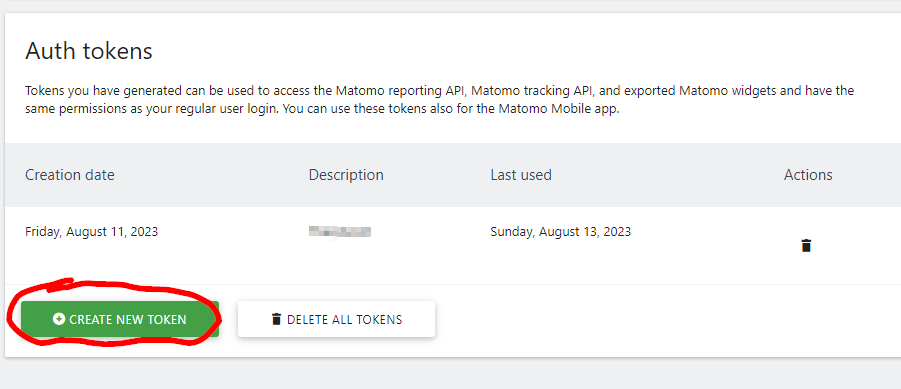
To make the API calls, we will need an API token. You need to be a Matomo administrator in order to issue one.
In the Matomo backend, go to Administration -> Personal -> Security, and scroll down to the bottom of the page. Here, you can issue a new token, by providing a small description. Store the token for later use.
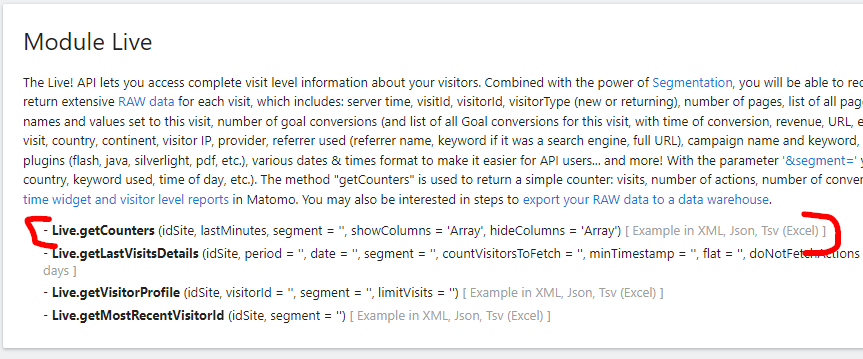
The best way to find your bearings is to to use the API page in the administration backend: Platform -> API. There are several modules installed, each of which cover different topics in Matomo (e.g. goals, forms, pages).
Live
We will have a look at a very simple API module to start with. It’s called Live. It returns the number of visitors and pages in the last X minutes. It can be used to get some basic, real-time traffic information about the site.
Here’s the call for the counters of the last 30 minutes. For authentication, you have to provide the API token you created in the previous step (replace MyToken with your token). No further authentication is necessary, which is very convenient. You can play around with the API calls by clicking on the links provided in the API overview page.
https://matomo.mywebsite.com/index.php?module=API&
  method=Live.getCounters&idSite=2&lastMinutes=30&
  format=xml&token_auth=MyToken
Here’s the XML that is returned:
<result>
	<row>
		<visits>18</visits>
		<actions>40</actions>
		<visitors>16</visitors>
		<visitsConverted>0</visitsConverted>
	</row>
</result>
VisitsSummary
Now, we will look at the VisitsSummary module and its getVisits method. With getVisits, you can get classic website reports, like the numbers of daily visitors for the past 60 days. You can then turn that data into a nice line chart later. Here’s the call:
https://matomo.mywebsite.com/index.php?module=API&
  method=VisitsSummary.getVisits&idSite=2&period=day&
  date=last60&format=xml&token_auth=MyToken
Here’s the returned XML:
<results>
	<result date="2023-06-16">16</result>
	<result date="2023-06-17"/>
	<result date="2023-06-18">1</result>
	<result date="2023-06-19">30</result>
	<result date="2023-06-20">32</result>
    </more data>....
</results>
Building the data source in Peakboard Designer
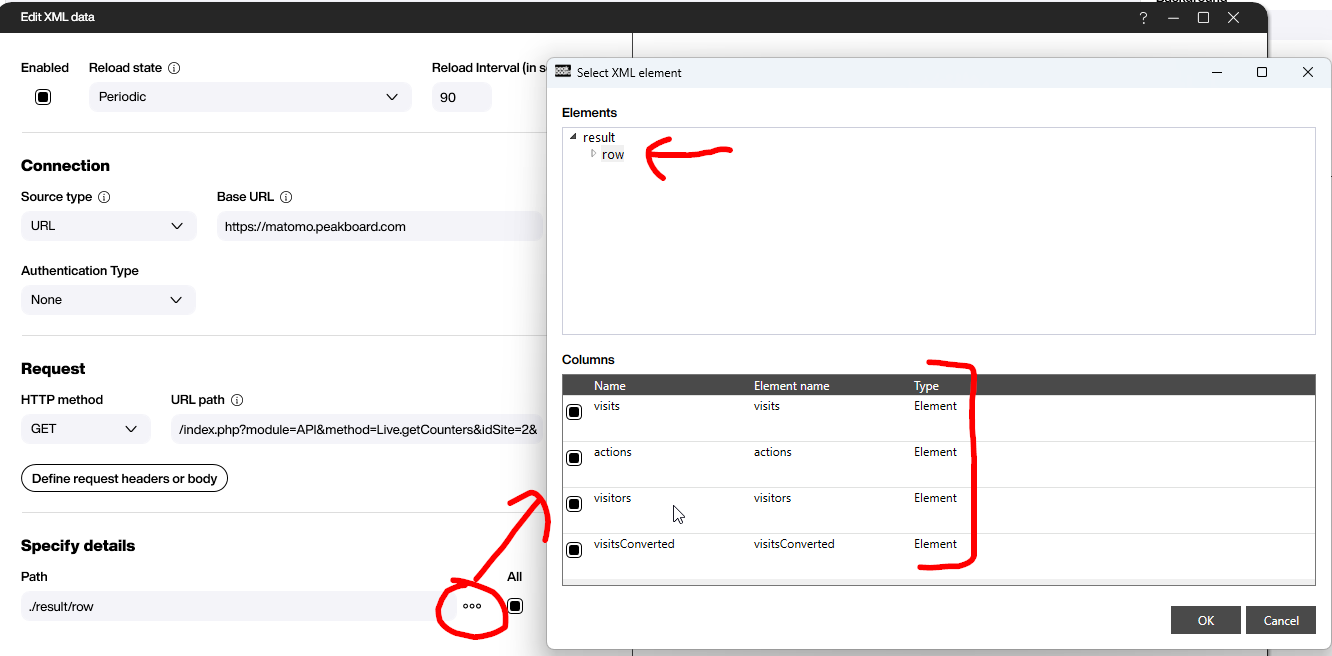
In Peakboard Designer, we will process the data with a simple XML data source.
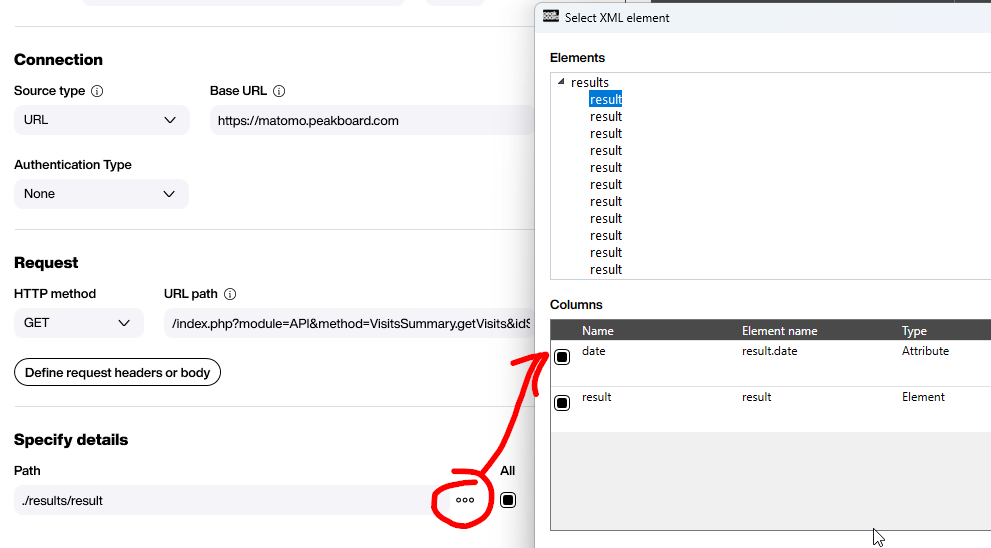
The following screenshot shows the first call. The trick is to find the path that specifies the data you’re interested in, within the XML. Just press the value help button for the path. You can explore the XML hierarchy and select the branch and values you’re interested in.
Now, we build a table with a single row:
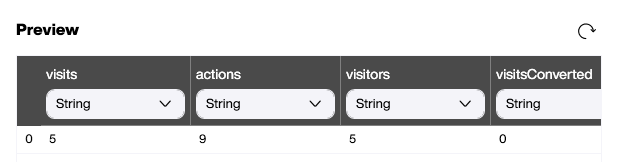
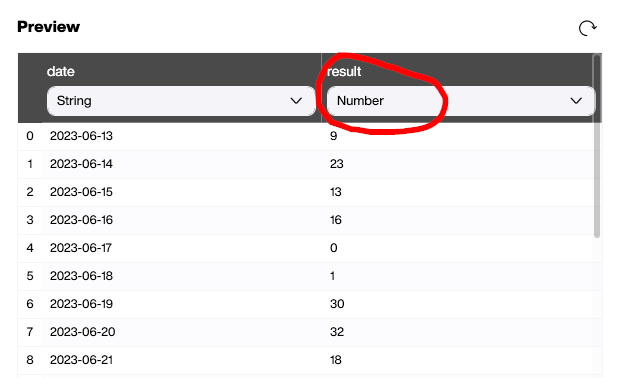
We do the same for the second call:
However, the nature of the XML is a little bit different, so we get a table back. The important thing here is that we need to change the data type of the visitors from String (which is the default) to Number. Later, we will use this table directly in a chart, and only numbers can be used for the y-axis.
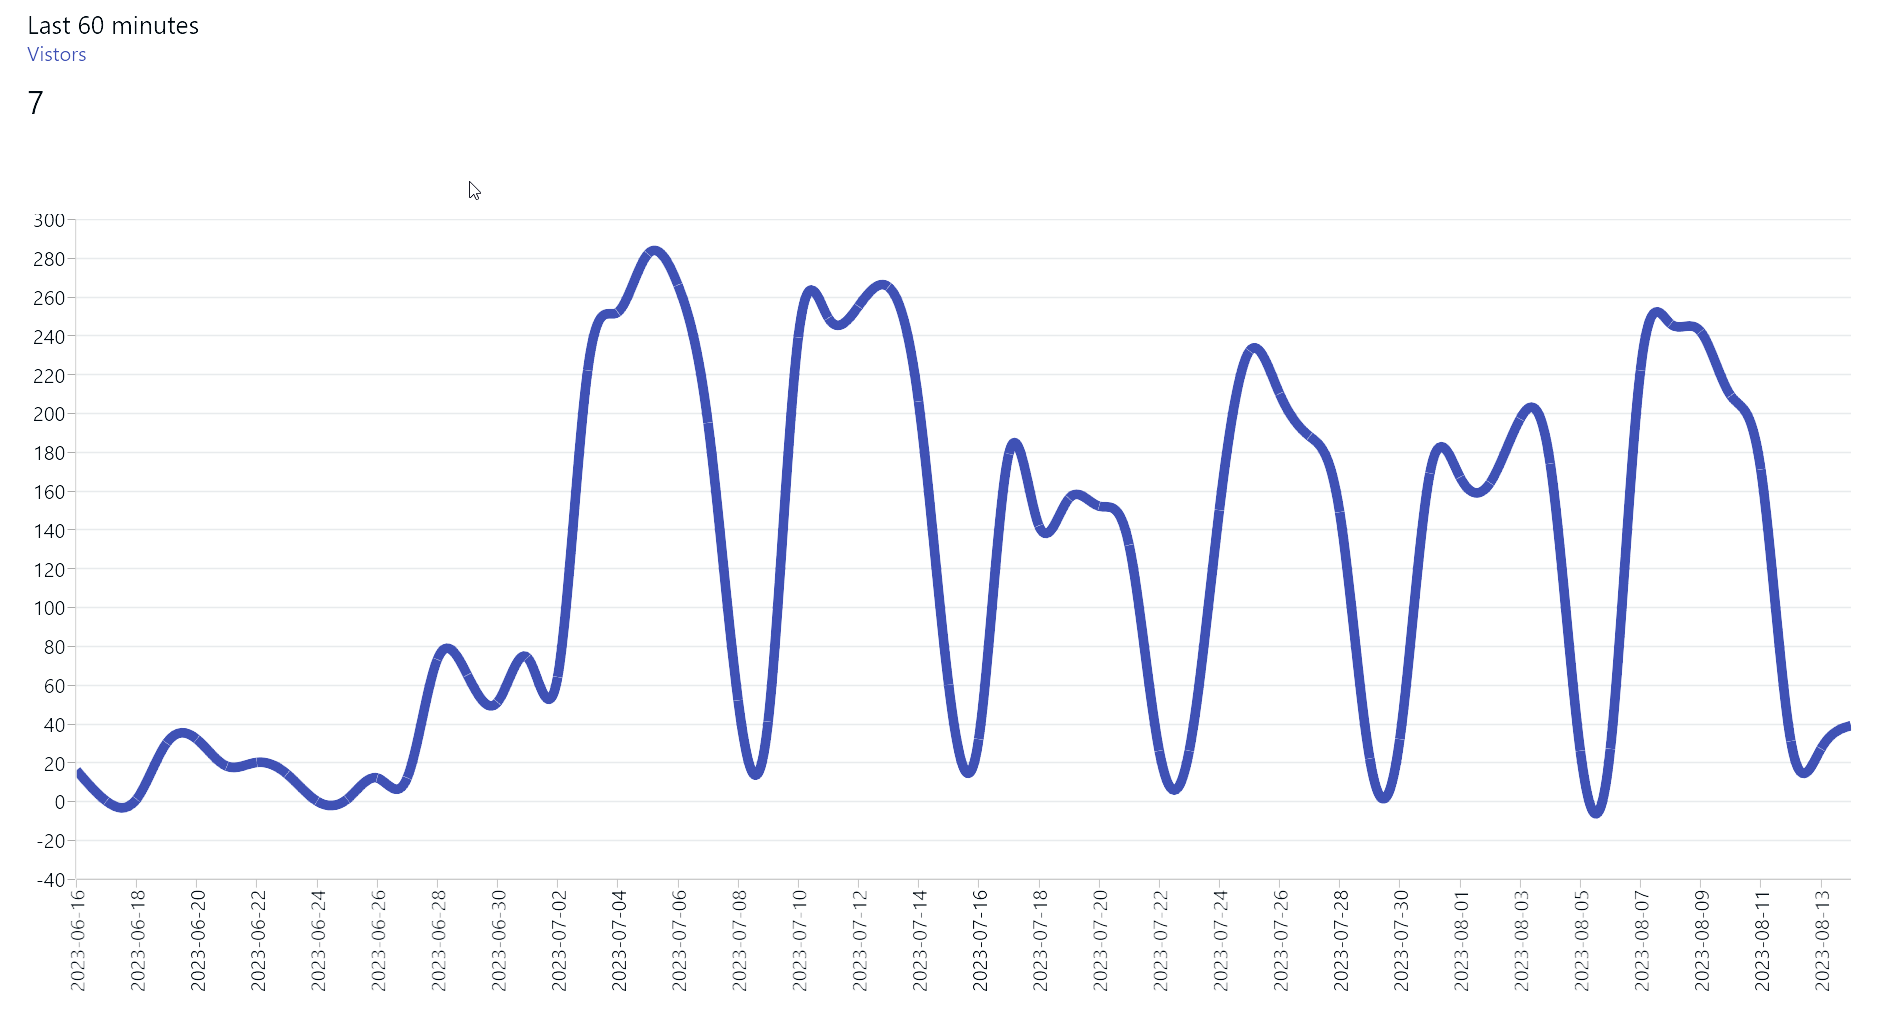
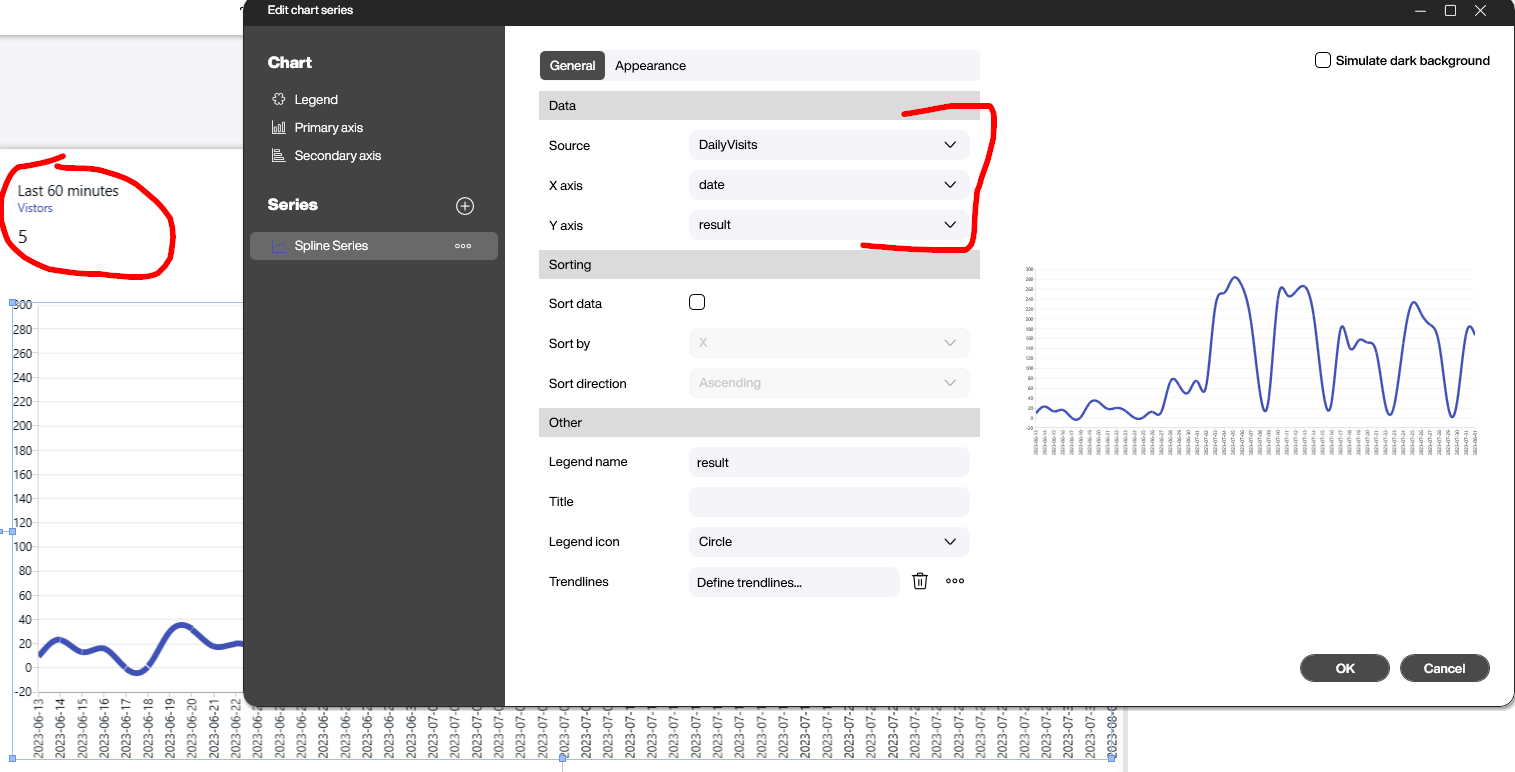
Preparing the canvas is straightforward. The number of real-time visitors is presented through a simple text field with a title and subtitle (see top-left corner). And the chart is a simple spline chart that is bound directly to the second data source. Feel free to download the PBMX file if you’re interested in more details (see bottom of the page).
And here’s the final result: