With the new version 4.1, the Peakboard Dev team introduced a whole new level of debugging for Peakboard applications. Up to this point, debugging mainly relied on log messages. These are generated automatically by the Peakboard Runtime Engine for almost any activity and, of course, for any errors that occur. There are also info messages that can be generated by the application itself, which are written into the log message stack in both preview and runtime. Log messages can also be retrieved from the boxes.
In this article, we will discuss the debug panel, which is perfect for monitoring data artifacts within a Peakboard project and gives testers access to functions to call them manually.
Regular Log Messages
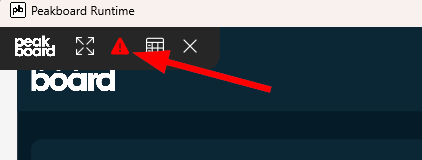
Just a reminder for those new to Peakboard debugging: all application messages can be accessed by clicking the corresponding button in preview mode. A panel appears on the right side and lets the user filter all application messages that were recently generated by the Peakboard application. Nice pro tip: In the very right and upper corner, there’s a detach button to detach the panel from its position on the right. Then, we can freely move the panel if we want it at a different position.

The Debug Panel
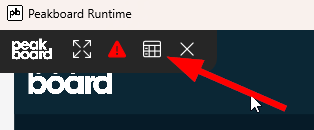
What is really new since version 4.1 is the debug panel, which can be accessed through the corresponding button.
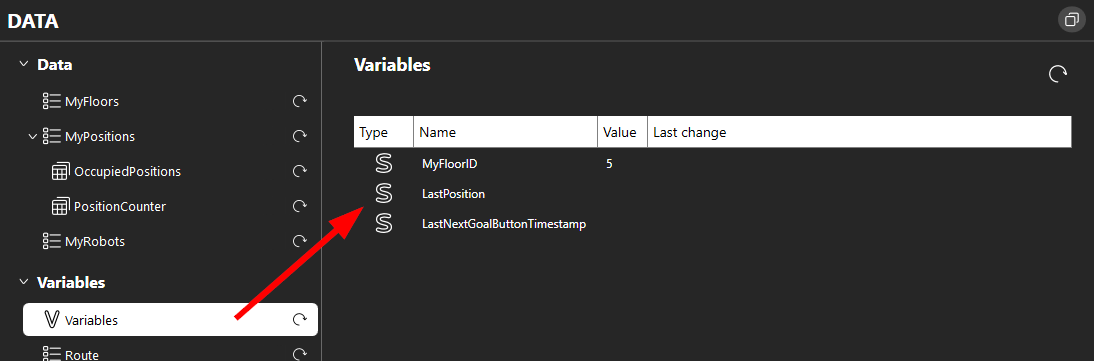
In a hierarchical tree, we can find all data artifacts like data sources, data flows below the data sources, scalar variables, and variable lists. For data sources, we can observe some metadata, like the last load and, even more importantly, the time it took to load the data and, of course, the data itself. With the refresh button, we can re-trigger the data source. Potential error messages are shown directly below the data table.
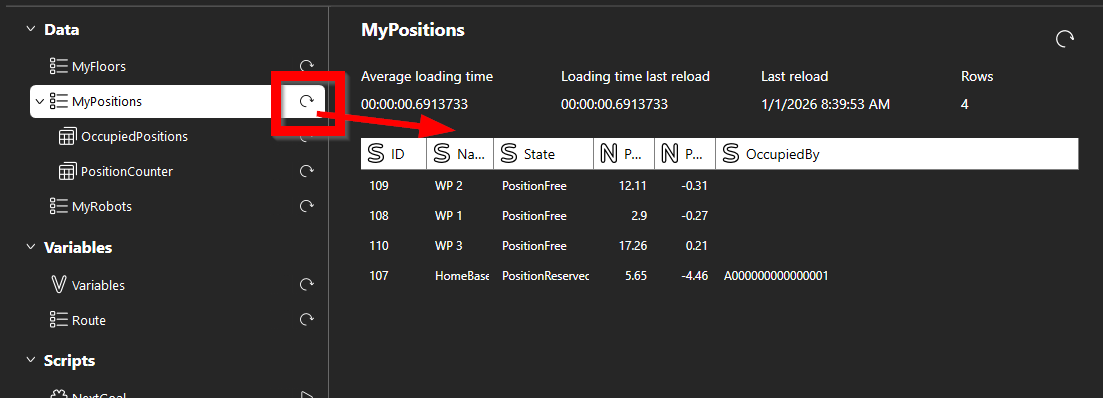
Scalar variables are shown in one dedicated table. For variable lists, the function is the same as for data sources.
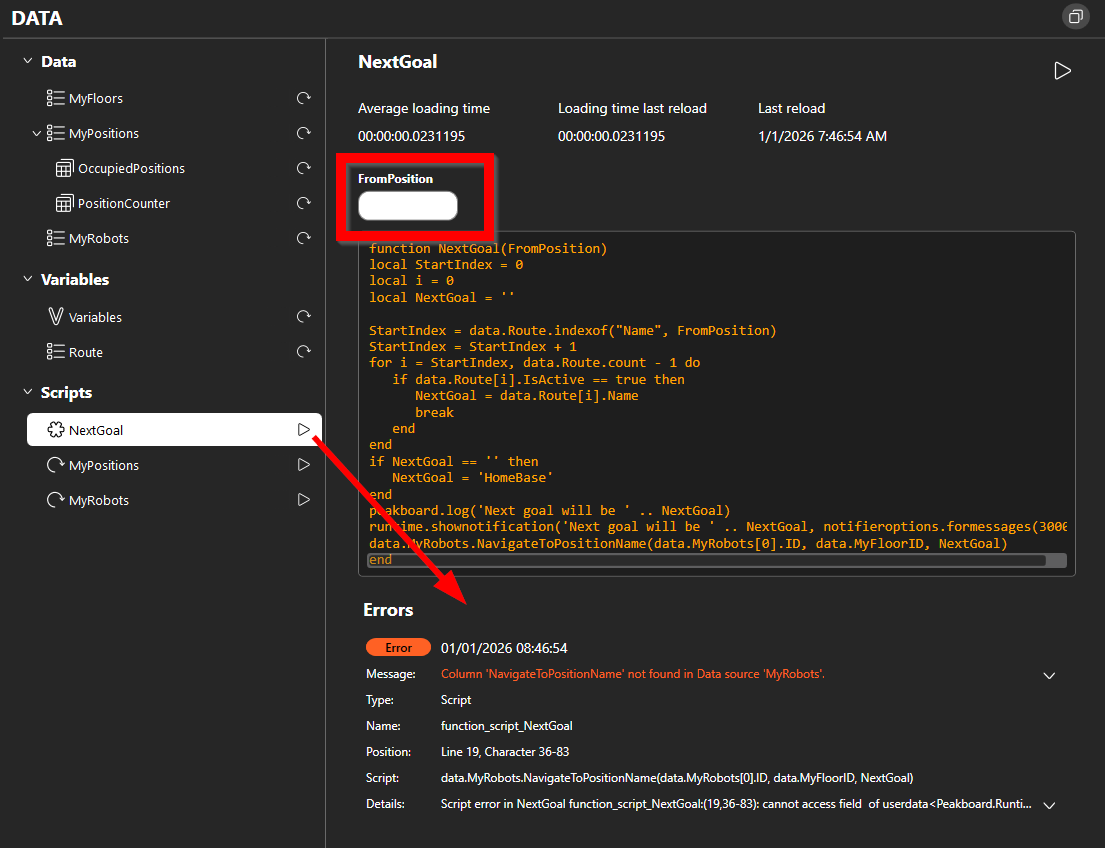
Functions
For functions, we can trigger execution manually by hitting the Play button. For functions with parameters, the values can be filled through the appropriate text boxes. All error messages are shown directly below the function. Important to know: All refresh scripts that are triggered manually do not refresh the data source. They only run the refresh script again on the data that is already there.