Azure Event Hubs is a high-throughput, real-time data ingestion service. You can think of it as a large, scalable entry-point for streamed data (e.g. telemetry, logs, sensor data, clickstreams, IoT signals).
In factory environments, Azure Event Hubs are often used to ingest telemetry and sensor data from machines. To learn the basics of Event Hubs and understand how data moves from publishers to consumers, check out Microsoft’s introduction to Azure Event Hubs.
Event Hubs and Peakboard
There are two ways to use Azure Event Hubs with Peakboard:
- A Peakboard Hub Flow acts as an event publisher. The Hub Flow streams events to an Azure Event Hub.
- A Peakboard app acts as an event consumer. The Hub Flow subscribes to specific events from an Azure Event Hub. The Azure Event Hub streams those events to the Hub Flow.
In this article, we’ll explain how both of these work, by building an event publisher Hub Flow and an event consumer Peakboard app. But first, we need to set up things on the Azure side.
Create Event Hubs namespace
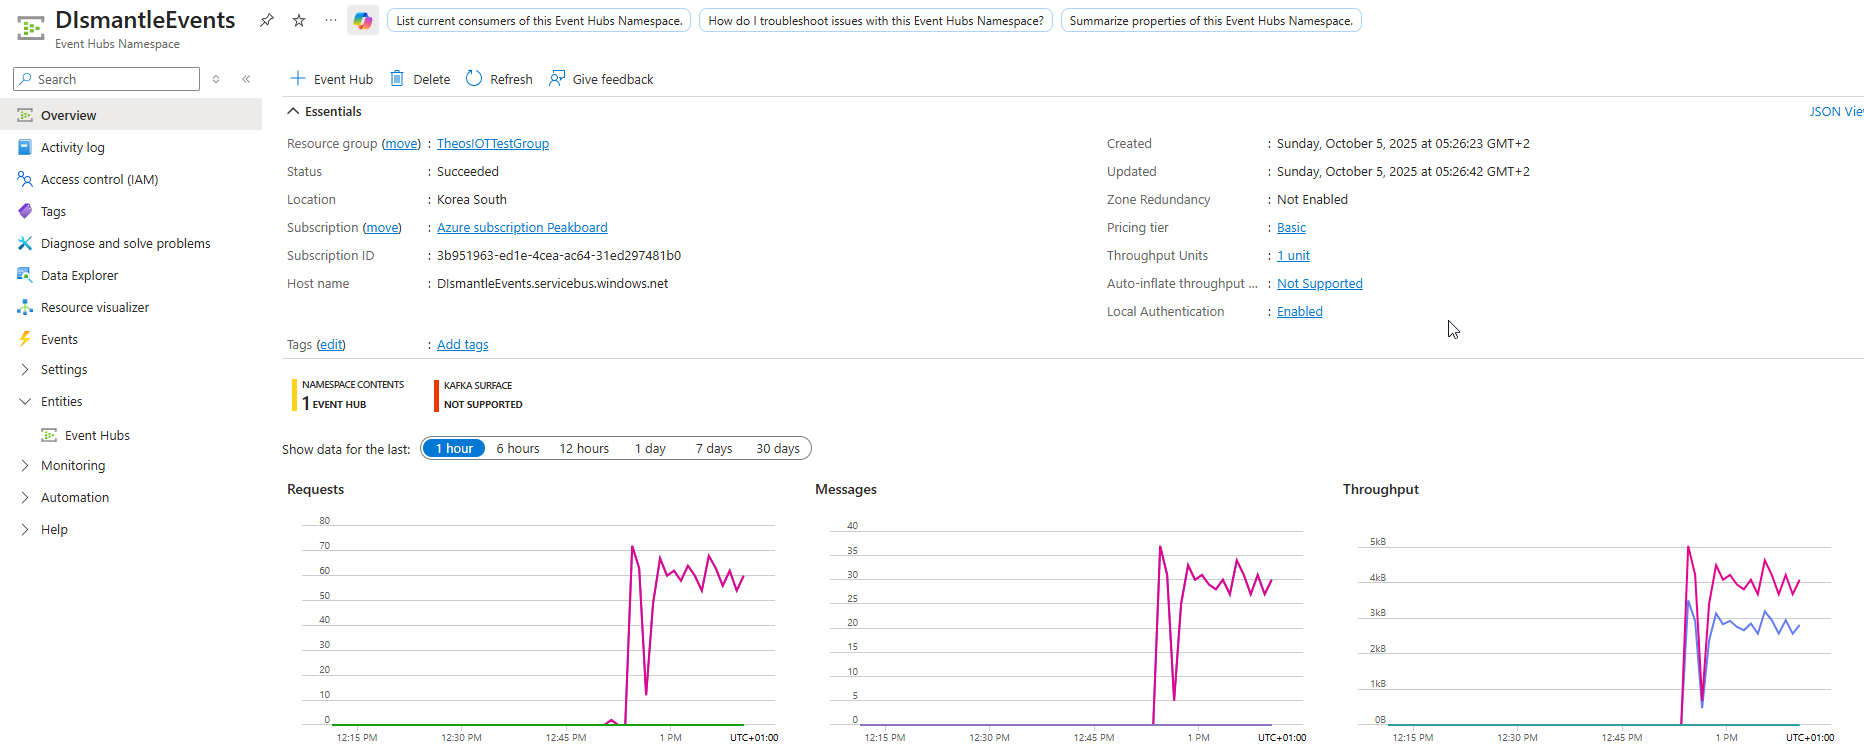
First, we create an Event Hubs namespace. An Event Hubs namespace is a collection of one or more Event Hub instances. The namespace contains the actual Event Hub instance that we will use use. Here’s what our DismantleEvents namespace looks like:
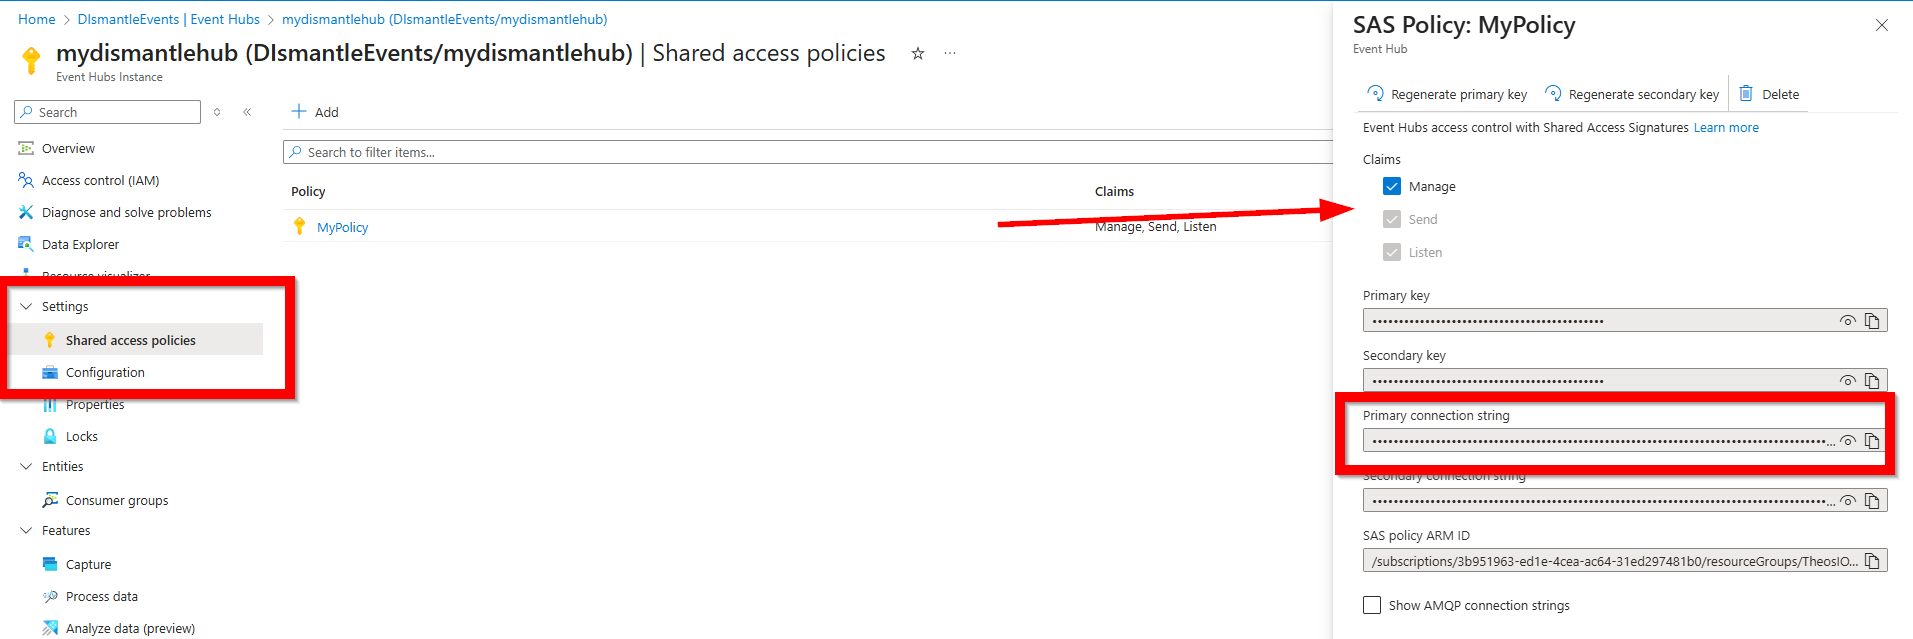
Next, we create an access policy, in order to authorize our Peakboard app to connect to the Event Hub:
- From the sidebar, we go to Settings > Shared access policies.
- We create a new access policy and enable the Manage permission.
- We copy the connection string. Our app will need it later.
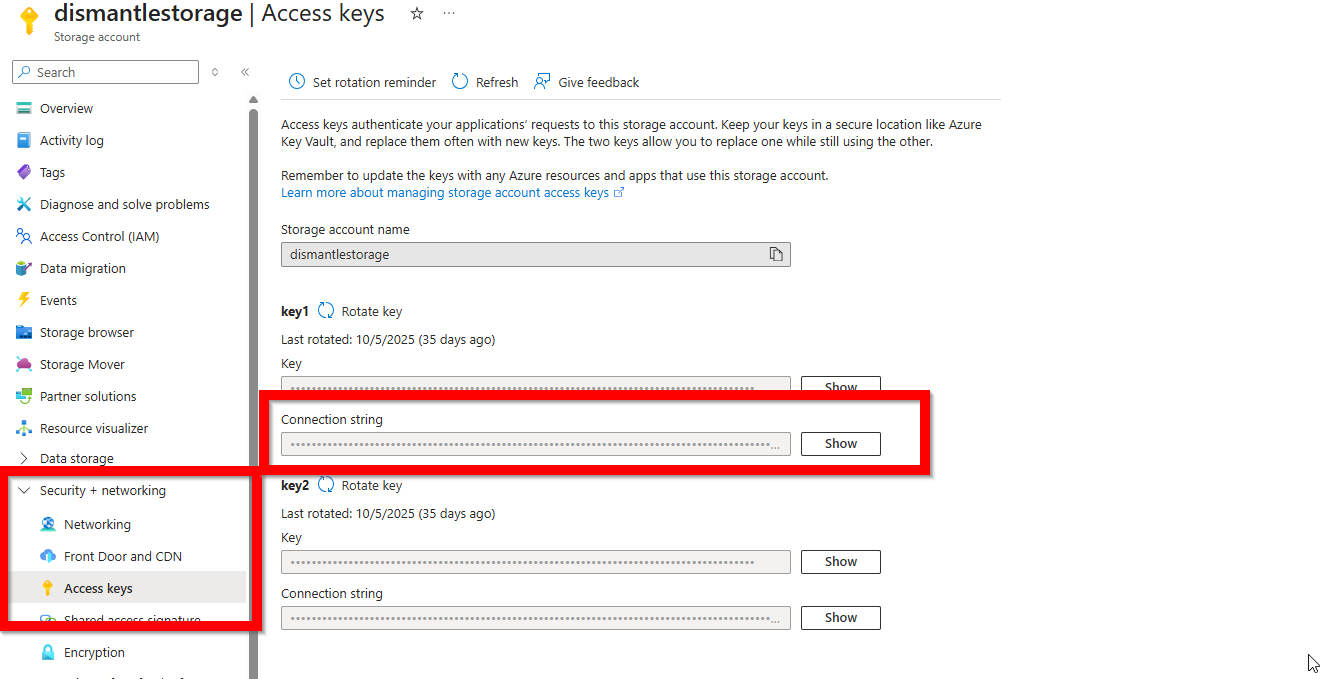
Configure a storage account
Next, we create an Azure storage account.
Then, we go to Sidebar > Security + networking > Access keys and copy the connection string. Our app will need it later.
We’ll use the storage account to store the stream offsets of our Event Hub’s partitions. These offsets keep track of where the newest event is located, for each partition.
Demo introduction
Now, we’ve finished all the setup on the Azure side. So it’s time to start working on Peakboard side. We create two separate projects:
- A Hub Flow that acts as an event publisher. This Hub Flow subscribes to the OPC UA nodes for two light barriers. When either of the light barriers updates their counters, the Hub Flow gets the updated value via OPC UA. Then, the Hub Flow sends the updated value to the Azure Event Hub.
- A Peakboard app that acts as an event consumer. This Peakboard app subscribes to the light barrier events of the Azure Event Hub. The Peakboard app displays the counter values on screen and updates them whenever the Event Hub sends a new event.
Event Hub data source
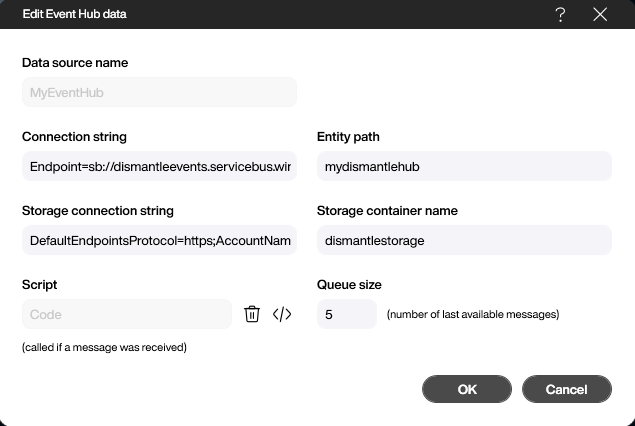
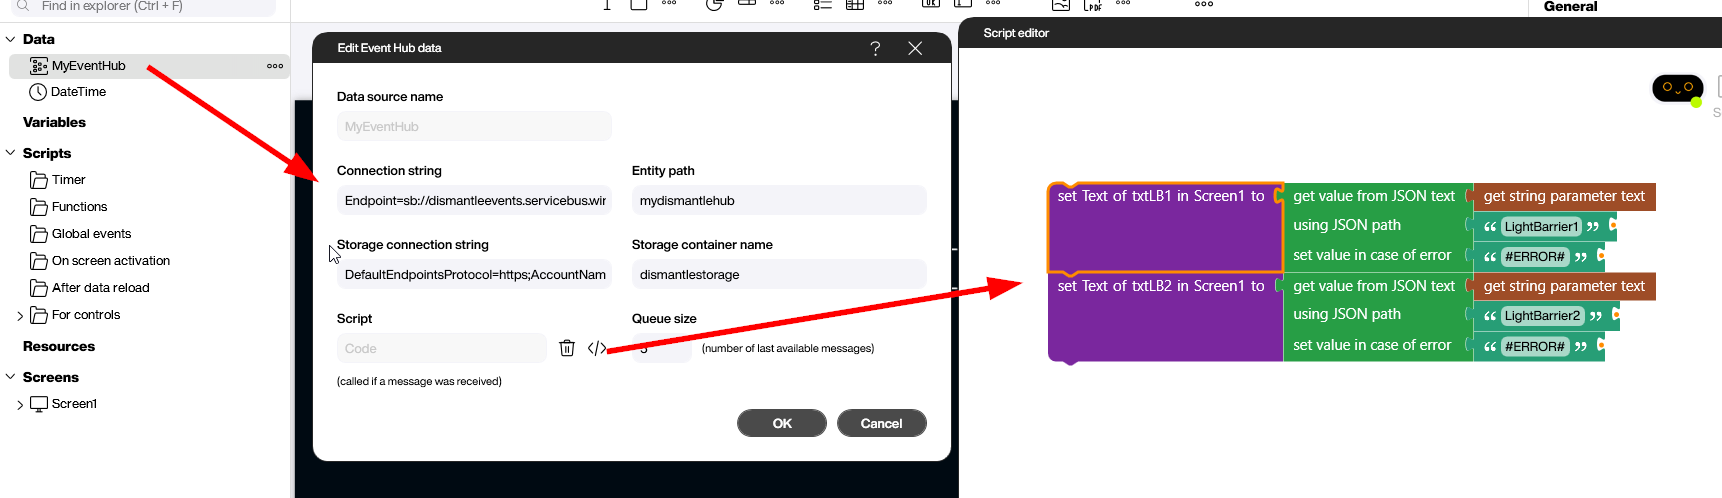
For both projects, the first step is the same: create an Event Hub data source and configure it.
To configure the data source, we enter the connection strings for both the Event Hub and the storage account. We also enter the Event Hub name and the storage account name.
Create an event publisher
Now, let’s create a Hub Flow that acts as an event publisher. This Hub Flow connects to a pair of light barriers via OPC UA. When either light barrier sends an updated value, the Hub Flow sends that new value to our Azure Event Hub.
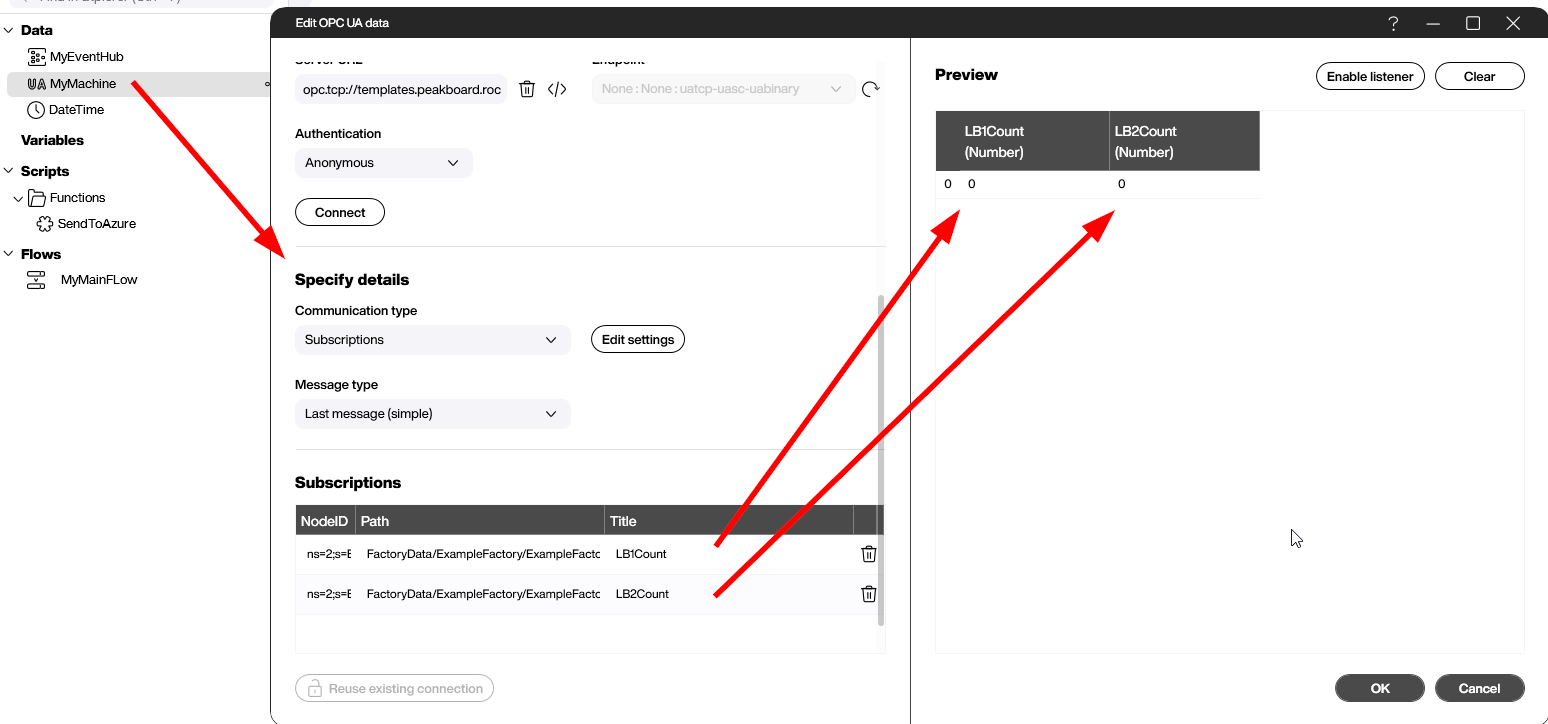
Add the OPC UA data source
First, we create an OPC UA data source. We subscribe to two OPC UA nodes—one for each light barrier’s counter. These counters keep track of the number of goods that pass through the light barriers. Because there are two counters, our data source returns two columns—one for each counter.
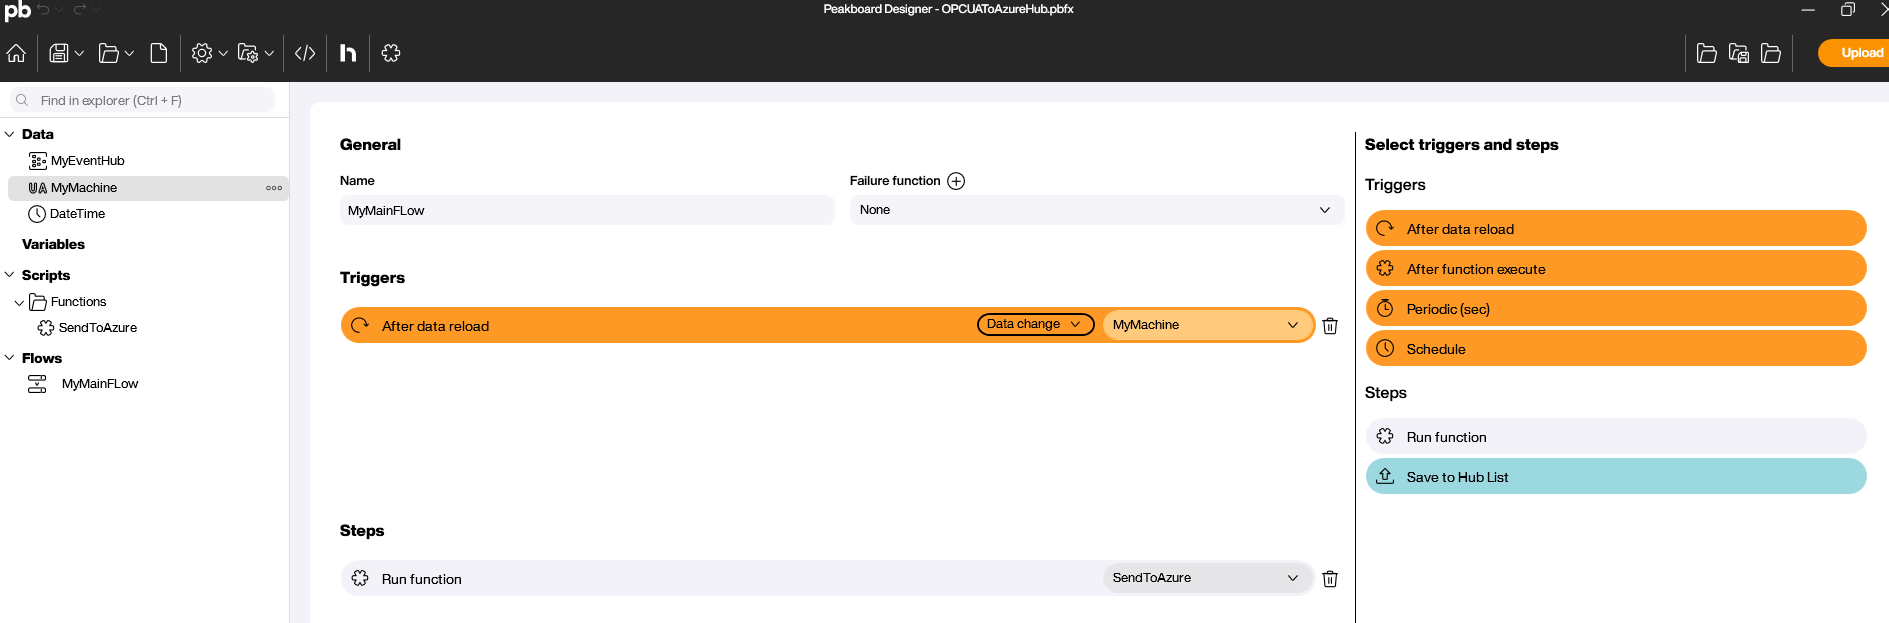
Create the Hub Flow script
The following screenshot shows our finished Hub Flow. The Flow is triggered by the OPC UA data source. Each time one of our two light barriers sends an updated value, the Flow is triggered, and it calls the SendToAzure function.
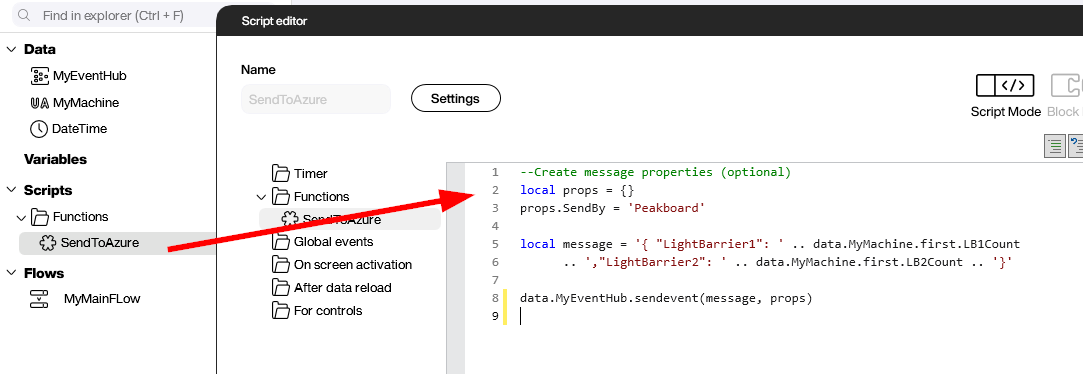
Create the SendToAzure function
The final step is to create the SendToAzure function, which sends the updated counter values to our Event Hub.
SendToAzure calls the sendevent function (a function that’s provided by the Azure Event Hub data source). sendevent takes two parameters:
- The message to send. In our case, we use a JSON string that contains the two light barrier counter values.
- A set of properties that contain the metadata for the message. These properties can be used with the Event Hub to perform message routing or other logic. Note: In the following screenshot, we set a
SendByprop toPeakboard. This property is just for demonstration purposes. It doesn’t actually do anything.
Once we deploy our Flow onto Peakboard Hub, it starts working right away and sends all subscribed light barrier values to our Event Hub.
Create an event consumer
Now, let’s create a Peakboard app that acts as an event consumer. This app subscribes to the Event Hub light barrier events. The app displays the counter values on screen and updates them when it receives new data from the Event Hub.
The output of the Event Hub data source is a table with two columns: Timestamp and Message. The maximum number of rows is specified by the Queue Size parameter. The data can be processed with standard patterns, like a reload event or a data flow.
Alternatively, we can use a special event that is fired for each arriving message. The logic is built with Building Blocks within this event. In our example, we parse the incoming message and assign the values of the light barriers to two text blocks, in order to show the value.
This approach keeps the consumer logic adaptable and ready for future enhancements—such as reacting to additional properties in the event payload.
Result
In the following screenshot, you can see what our Peakboard app looks like. The light barriers send OPC UA messages to the Hub Flow, which forwards the messages to the Event Hub, which then forwards the messages to the Peakboard app. Finally, the app displays the raw data in a table (using a table control bound to the data source), as well as two text blocks that show the processed values from the incoming messages.
This example also highlights how quickly production data can flow through multiple systems, if the connections are configured properly.