This article is part 5 of our Hub Flows series. Today, we’ll discuss how to handle high-volume transaction data. Before continuing, make sure you understand the basics of the Hub Flows.
Introduction
Many of the machines and sensors in a warehouse or factory produce large amounts of data, continuously. And Peakboard apps often use this data to do different things, such as visualizing the data, providing data insights, or sending a notification when anomalous data is detected.
Data pre-aggregation
However, applications often do not need or want the raw data from the machines. For example, let’s say you have a temperature sensor in your warehouse. And let’s say you have a Peakboard application that outputs the maximum, minimum, and average temperatures of the last 7 days.
But the temperature sensor generates new data every 6 minutes. So the Peakboard app has to get the raw data and aggregate it itself. And in the real world, you may have multiple Peakboard apps use the same data—and each one would need to independently aggregate the data. It would be better if we could provide pre-aggregated data for our Peakboard apps.
So, our first goal is to build a Hub Flow that aggregates raw data, to make it easier for apps to consume.
Data archival
There’s another problem that we want to deal with. Because machines produce so much data, the tables containing the raw data will eventually grow very large, slowing down access speeds. And in the real world, there may be multiple apps that query the raw data, multiple times a day.
One way to deal with this is to delete old data. But what if we want to keep it for archival purposes? In that case, we should delete old data from the raw data table, and write it to an archive table.
So, our second goal is to build a Hub Flow that deletes and archives any data older than 7 days, from the raw temperature data table. This keeps the table small, so that queries to it remain fast. But, we keep all that deleted data in a separate table, so that it’s still accessible.
Temperature sensor
For our example Hub Flows, we will use data from a temperature sensor.
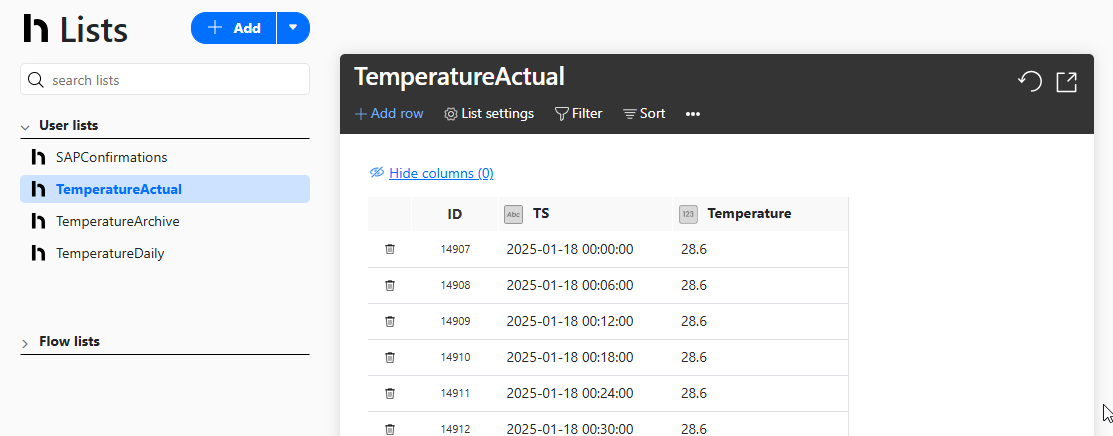
The raw temperature data is stored in a Hub list called TemperatureActual. Every 6 minutes, the sensor adds a new row to the table, with the timestamp in the TS column, and the current temperature in the Temperature column.
Build the data aggregation Hub Flow
Now, let’s build the Hub Flow that aggregates the data. Here’s an overview of how the finished Hub Flow works:
- The physical temperature sensor writes new data to the
TemperatureActualHub list, every 6 minutes. - The Hub Flow’s
TemperatureForAggregationdata source readsTemperatureActualand aggregates the data. - The Hub Flow writes the aggregated data from
TemperatureForAggregationto theTemperatureDailyHub list.
Create the aggregate data Hub list
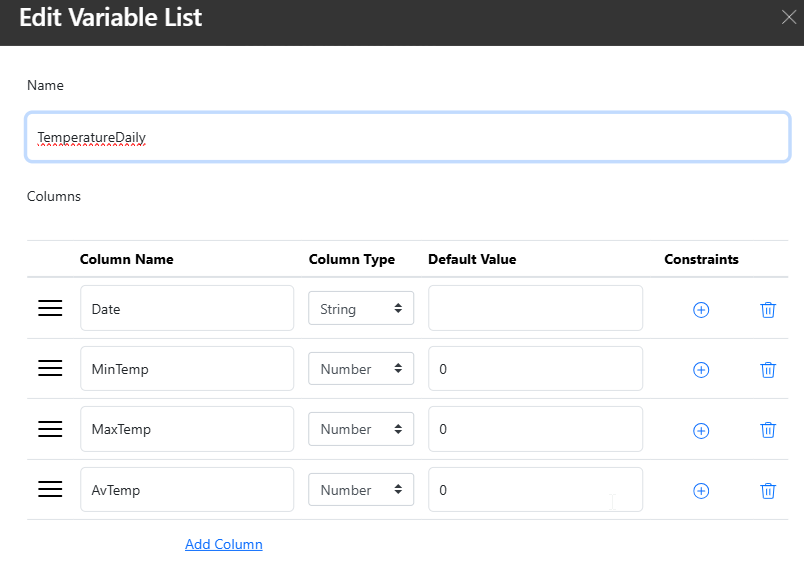
First, we create the Peakboard Hub list that will store the aggregated data. We name it TemperatureDaily. We add the following columns:
- The date
- The minimum temperature
- The maximum temperature
- The average temperature
Next, in our Hub Flow project, we add a data source for this Hub list, so that we can write to it later on:
Create the data source for the aggregate data
Next, we create the data source that generates the aggregate data. We set it to the following SQL statement:
select left(TS, 10) as Date,
    min(Temperature) as MinTemp,
    max(Temperature) as MaxTemp, avg(Temperature) as AvTemp
from TemperatureActual where TS < FORMAT(GETDATE(), 'yyyy-MM-dd')
    and left(TS, 10) not in (Select date from TemperatureDaily)
group by left(TS, 10)
order by 1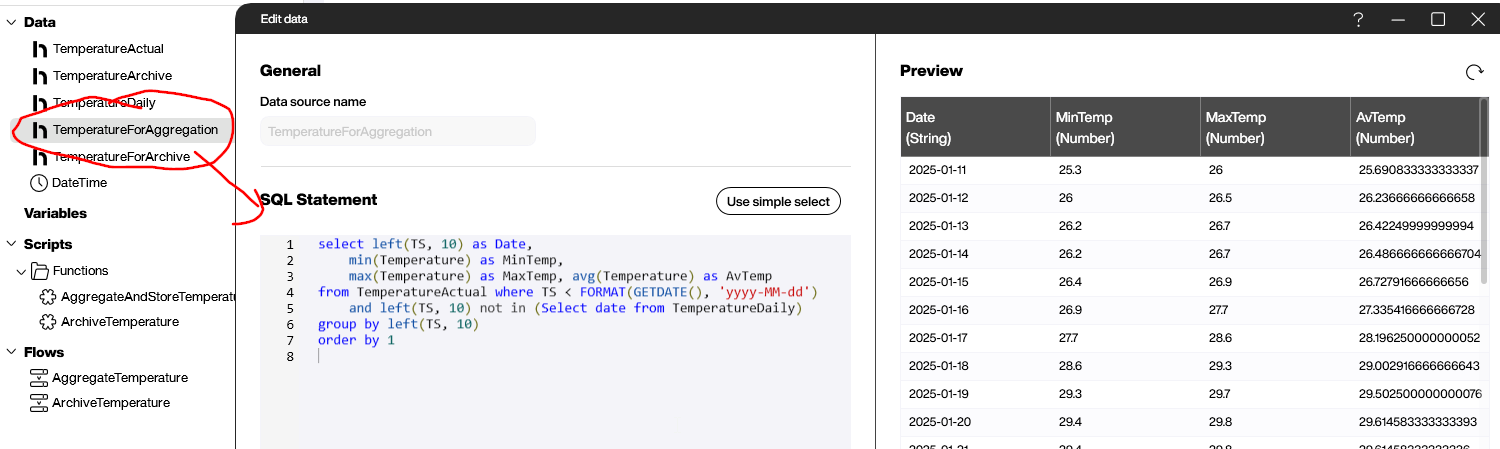
This SQL statement gets the raw data from the TemperatureActual table. It uses the where clause to do two things:
- Only get data from before the current date (because the current date’s temperatures are still being recorded).
- Only get data for dates that aren’t already in
TemperatureDaily. (We useleft(TS,10)to get the first 10 characters from the timestamp. This is the date, without the time.)
To actually aggregate the data, it uses SQL’s built-in min, max, and avg functions.
Create the function that writes the aggregate data
Next, we create a function called AggregateAndStoreTemperature. This function takes the aggregate data from our TemperatureForAggregation data source and writes it to the TemperatureDaily Hub list. Here’s what it looks like:
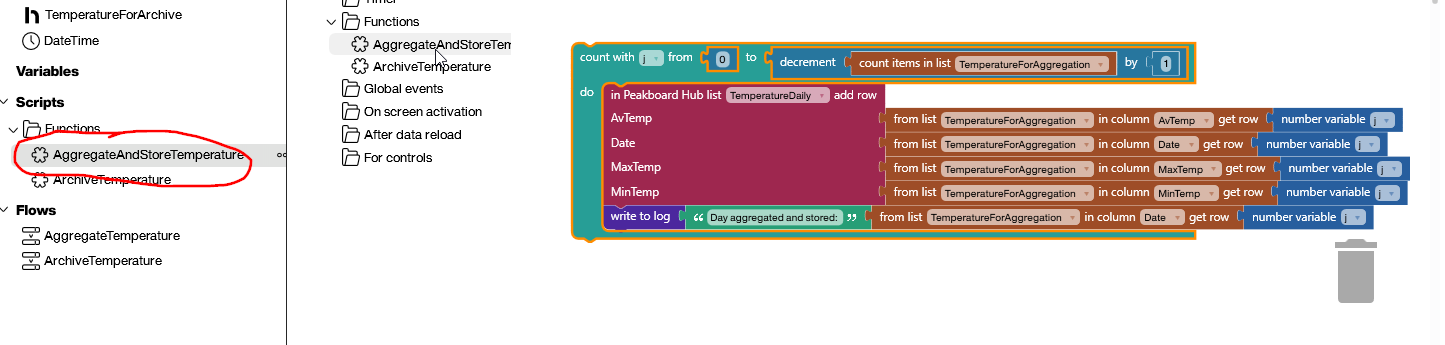
It loops over the TemperatureForAggregation data source and writes each line to the TemperatureDaily Hub list. Usually, this only writes one line per day, but if the function misses a day for whatever reason, then the missing row will be added the next day.
Create the Flow
Finally, we create the Flow itself. Here’s what it looks like:
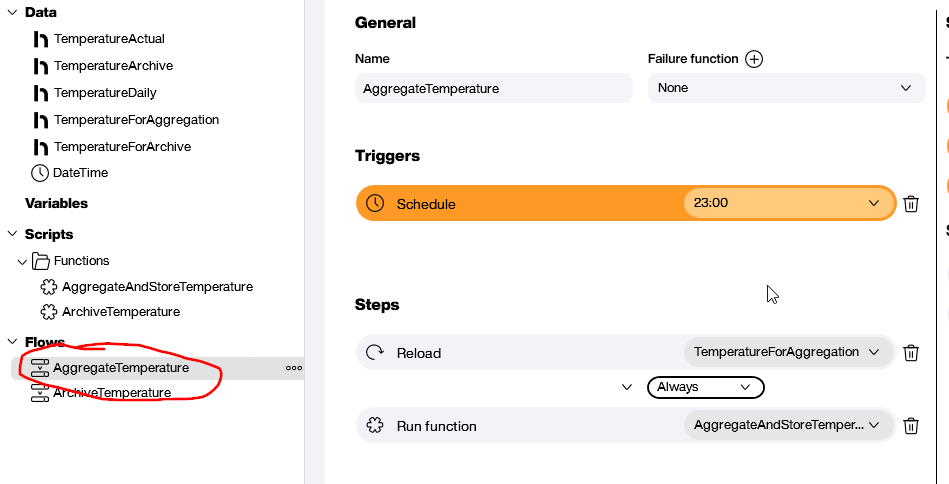
The trigger is a schedule that runs the Flow every day at 11 PM.
Here are the steps in the Flow:
- Reload the
TemperatureForAggregationdata source to update it with the latest temperature data. - Run the
AggregateAndStoreTemperaturefunction.
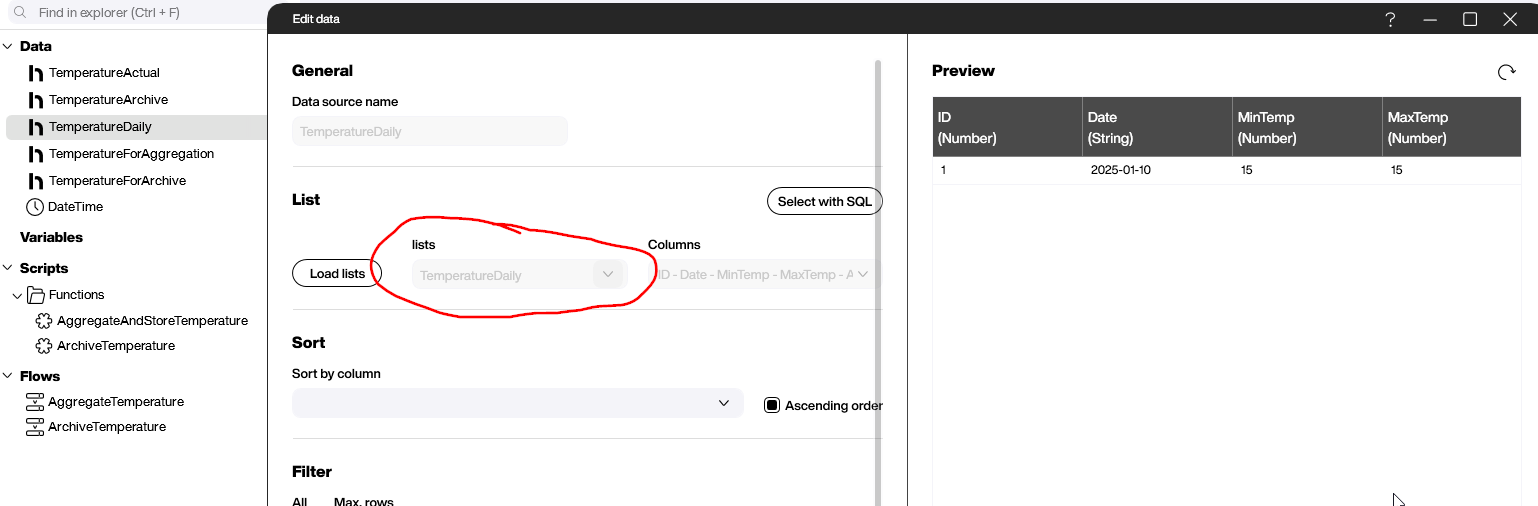
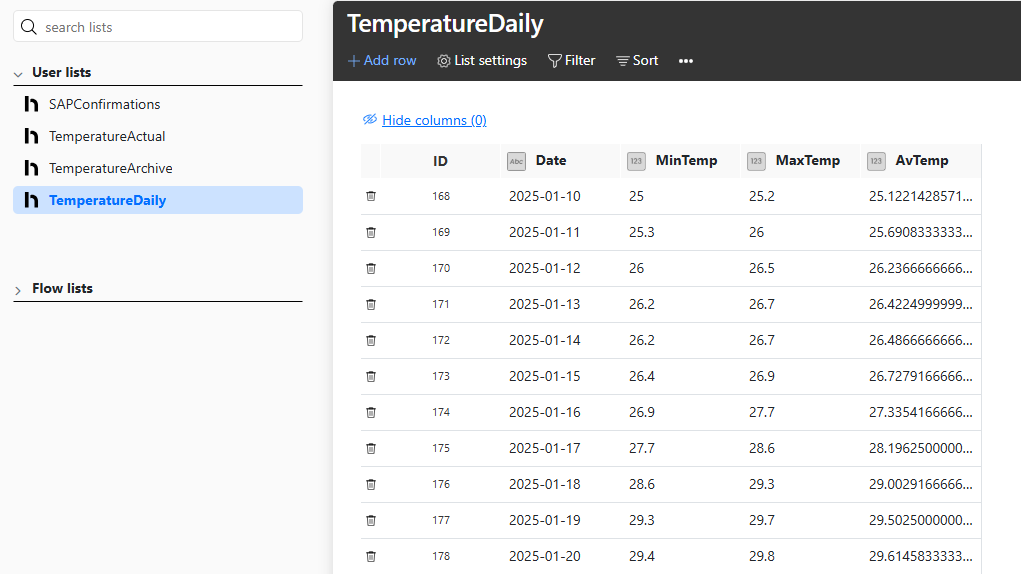
If the TemperatureDaily Hub list is completely empty—which it is the case when we first set up the Flow—then the Flow writes all the missing rows from the past 7 days. After that, the Flow only writes one row per day.
This screenshot shows what the Hub list looks like. You can see that January 10 is the first day that the sensor produced data, so it’s the first row of our list.
Build the data archival Hub Flow
Now, let’s build the Hub Flow that deletes and archives all raw data older than 7 days.
First, we create a new Hub list called TemperatureArchive, which will store all our archived data. Then, we add a data source for that Hub list to our Flow project, so that we can write to the Hub list.
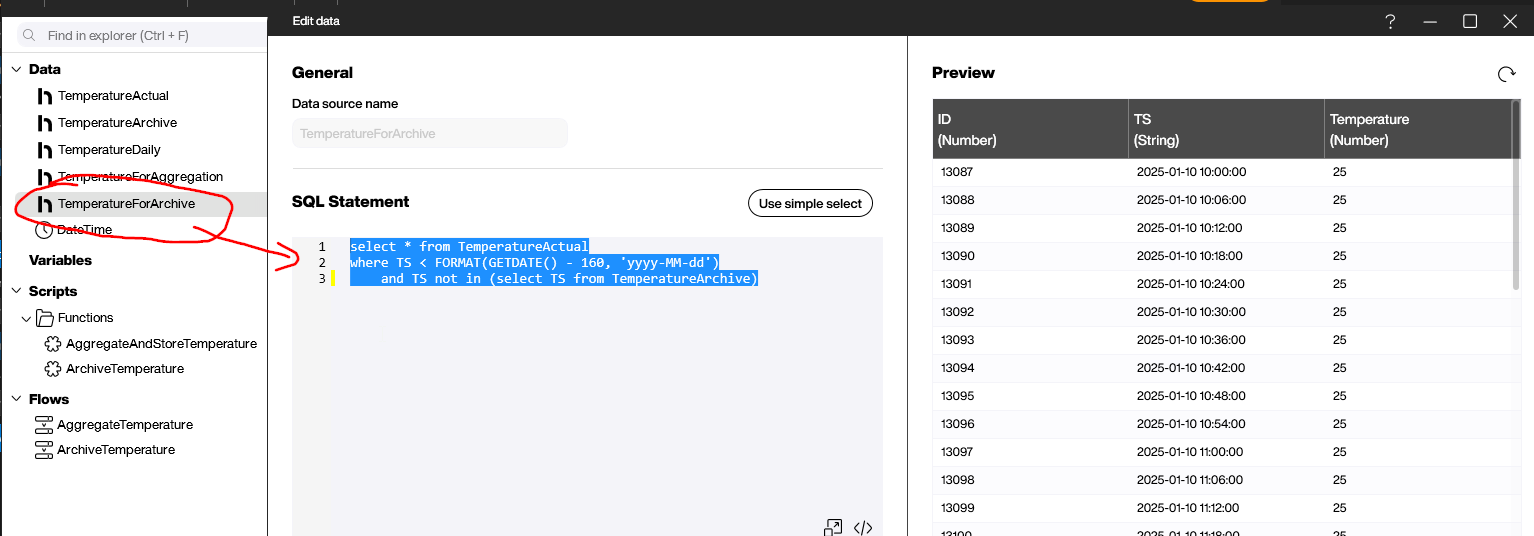
Next, we create the TemperatureForArchive data source, with the following SQL statement:
select * from TemperatureActual
where TS < FORMAT(GETDATE() - 7, 'yyyy-MM-dd')
    and TS not in (select TS from TemperatureArchive)
It selects all the data from TemperatureActual that’s older than 7 days and not yet in our TemperatureArchive Hub list.
Next, we create the function that modifies the Hub lists:
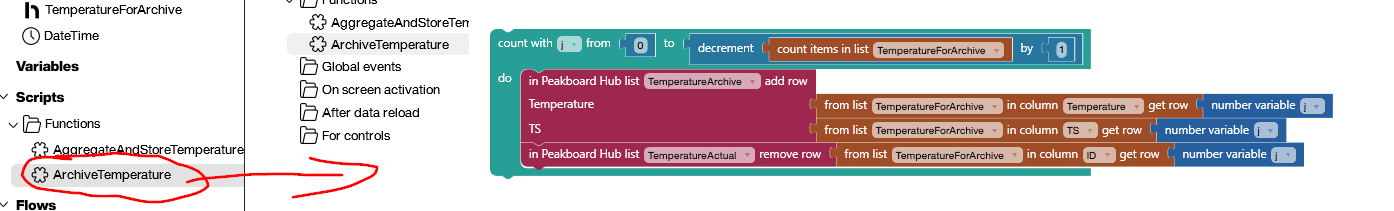
It loops over each row in the TemperatureForArchive data source. For each one, it does the following:
- Write the row to the
TemperatureArchiveHub list. - Remove the corresponding row from
TemperatureActual.
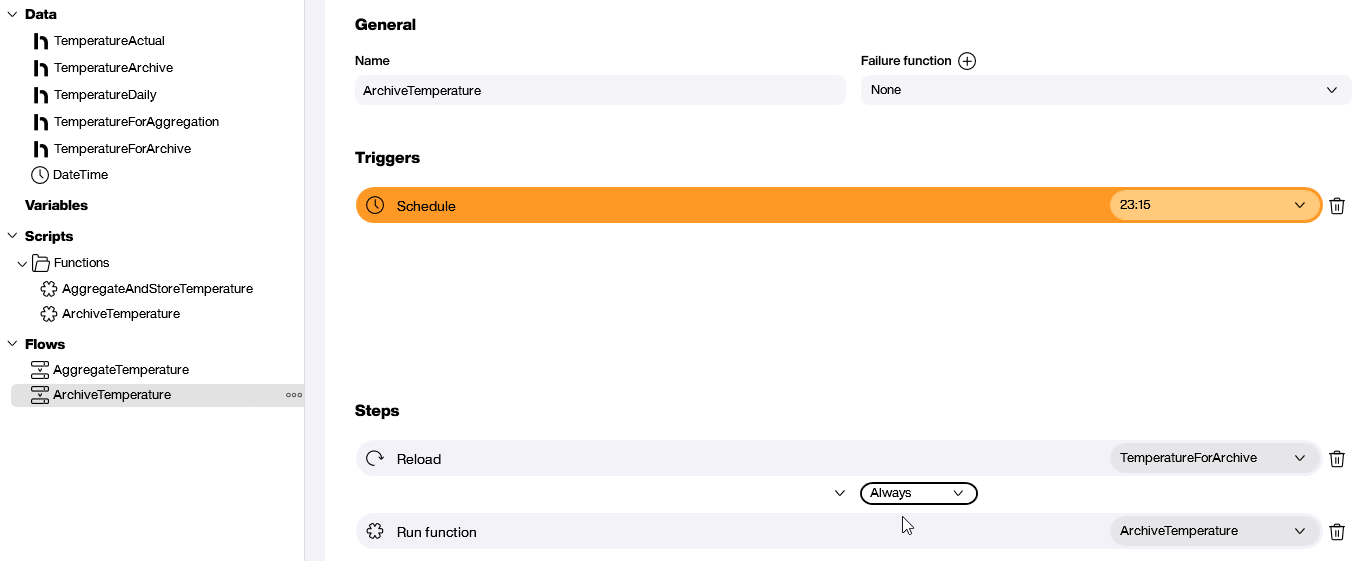
Finally, we add the Flow itself. It works similarly to our other Flow. It runs daily. It reloads the data source and then runs the ArchiveTemperature function:
Result and conclusion
We just looked at two ways that we can optimize tables: Pre-aggregation and archiving. You can even use one of them, or both, or even some combination of the two.
For example, you can aggregate the data and then delete the corresponding raw data. In this case, you lose that raw data forever—but if the data isn’t important, then it may make sense to do.
But the point is that once you understand the basic patterns, you can create your own custom Hub Flows to handle large volumes of data in whatever way fits your needs.